| __timestamp | CSX Corporation | Clean Harbors, Inc. |
|---|---|---|
| Wednesday, January 1, 2014 | 9056000000 | 2441796000 |
| Thursday, January 1, 2015 | 8227000000 | 2356806000 |
| Friday, January 1, 2016 | 7680000000 | 1932857000 |
| Sunday, January 1, 2017 | 7635000000 | 2062673000 |
| Monday, January 1, 2018 | 7477000000 | 2305551000 |
| Tuesday, January 1, 2019 | 7063000000 | 2387819000 |
| Wednesday, January 1, 2020 | 6221000000 | 2137751000 |
| Friday, January 1, 2021 | 7382000000 | 2609837000 |
| Saturday, January 1, 2022 | 9068000000 | 3543930000 |
| Sunday, January 1, 2023 | 9130000000 | 3746124000 |
| Monday, January 1, 2024 | 4065713000 |
Unleashing the power of data
In the world of transportation and environmental services, CSX Corporation and Clean Harbors, Inc. stand as titans. Over the past decade, CSX Corporation has consistently maintained a higher cost of revenue compared to Clean Harbors, Inc., reflecting its expansive operations in the rail transport sector. From 2014 to 2023, CSX's cost of revenue fluctuated, peaking in 2023 with a 47% increase from its lowest point in 2020. Meanwhile, Clean Harbors, Inc., a leader in environmental and industrial services, saw a steady rise, culminating in a 94% increase over the same period. This divergence highlights the distinct operational challenges and growth trajectories of these industry leaders. As CSX navigates the complexities of rail logistics, Clean Harbors capitalizes on the growing demand for sustainable solutions. This comparison not only underscores their financial strategies but also offers insights into the evolving landscape of their respective industries.
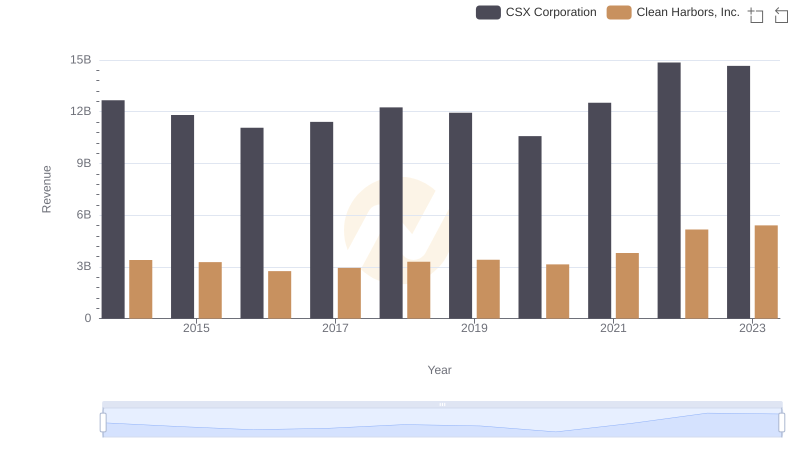
Revenue Insights: CSX Corporation and Clean Harbors, Inc. Performance Compared
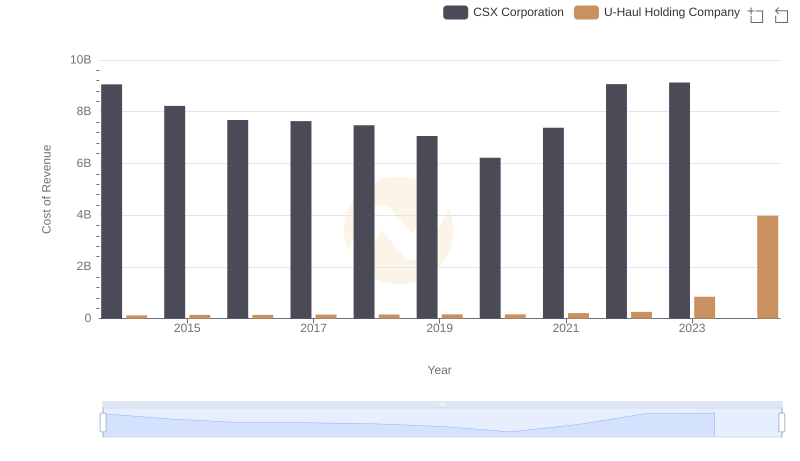
Cost Insights: Breaking Down CSX Corporation and U-Haul Holding Company's Expenses
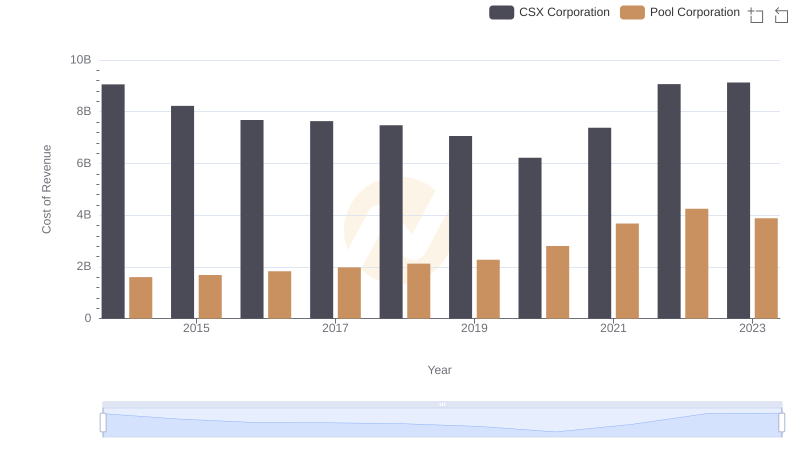
Comparing Cost of Revenue Efficiency: CSX Corporation vs Pool Corporation
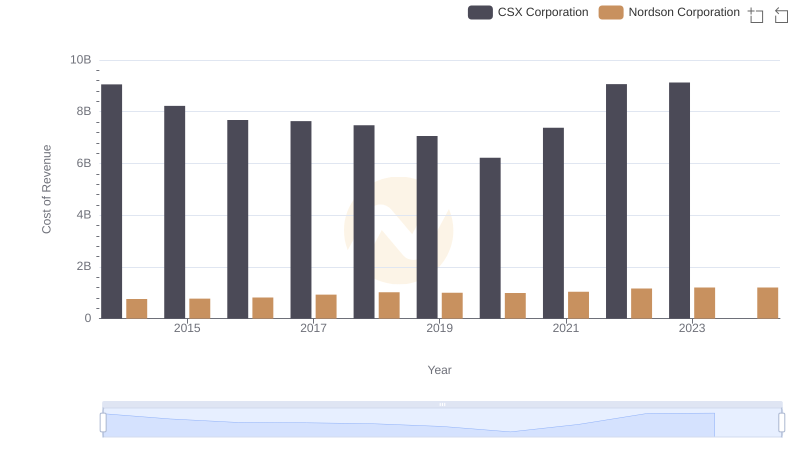
Cost Insights: Breaking Down CSX Corporation and Nordson Corporation's Expenses
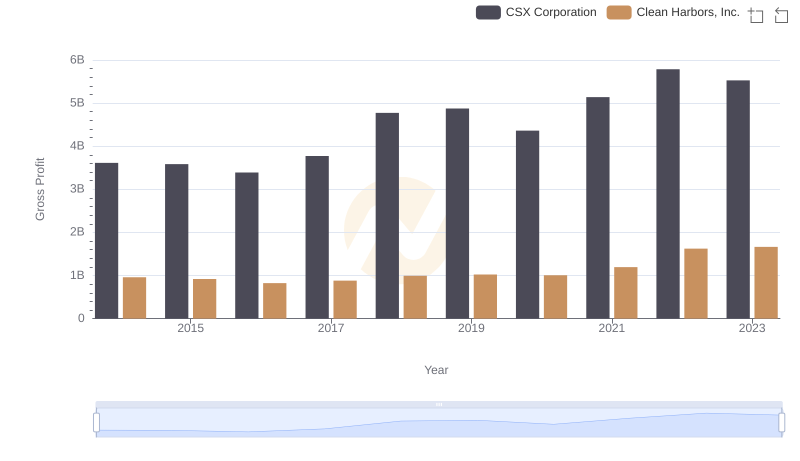
Gross Profit Analysis: Comparing CSX Corporation and Clean Harbors, Inc.
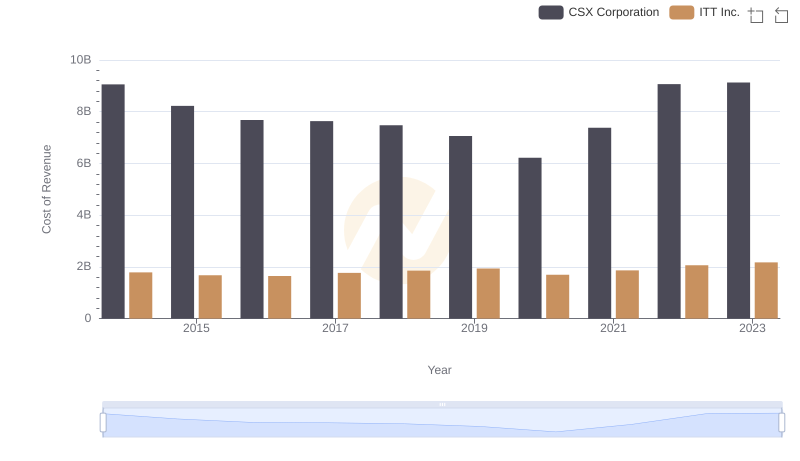
Cost of Revenue: Key Insights for CSX Corporation and ITT Inc.