| __timestamp | Cisco Systems, Inc. | Workday, Inc. |
|---|---|---|
| Wednesday, January 1, 2014 | 11437000000 | 263294000 |
| Thursday, January 1, 2015 | 11861000000 | 421891000 |
| Friday, January 1, 2016 | 11433000000 | 582634000 |
| Sunday, January 1, 2017 | 11177000000 | 781996000 |
| Monday, January 1, 2018 | 11386000000 | 906276000 |
| Tuesday, January 1, 2019 | 11398000000 | 1238682000 |
| Wednesday, January 1, 2020 | 11094000000 | 1514272000 |
| Friday, January 1, 2021 | 11411000000 | 1647241000 |
| Saturday, January 1, 2022 | 11186000000 | 1947933000 |
| Sunday, January 1, 2023 | 12358000000 | 2452180000 |
| Monday, January 1, 2024 | 13177000000 | 2841000000 |
Infusing magic into the data realm
In the ever-evolving tech landscape, understanding financial trends is crucial. This chart offers a fascinating glimpse into the Selling, General, and Administrative (SG&A) expenses of two industry leaders: Cisco Systems, Inc. and Workday, Inc., from 2014 to 2024.
Cisco's SG&A expenses have shown a consistent pattern, with a notable increase of approximately 15% over the decade. The company maintained a robust financial strategy, peaking in 2024 with expenses reaching 13.2 billion. This reflects Cisco's strategic investments in innovation and market expansion.
In contrast, Workday's SG&A expenses skyrocketed by over 980% during the same period, highlighting its aggressive growth strategy. From a modest 263 million in 2014, Workday's expenses surged to nearly 2.8 billion in 2024, underscoring its commitment to scaling operations and expanding its market footprint.
This comparative analysis not only highlights the differing financial strategies of these tech giants but also provides insights into their market positioning and future potential.
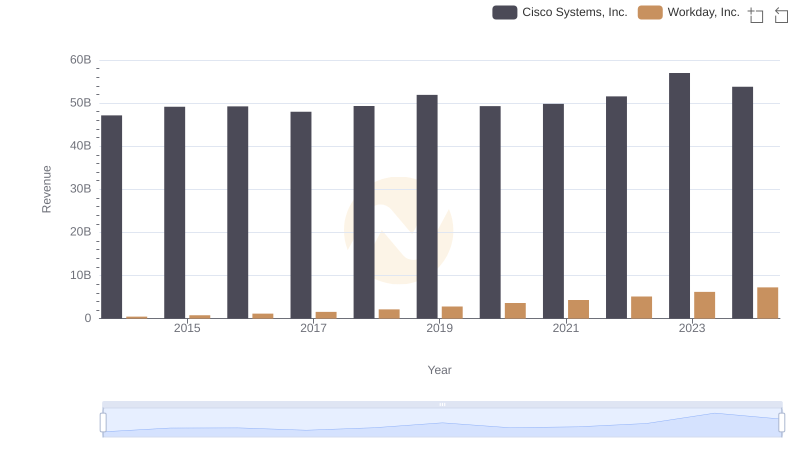
Breaking Down Revenue Trends: Cisco Systems, Inc. vs Workday, Inc.
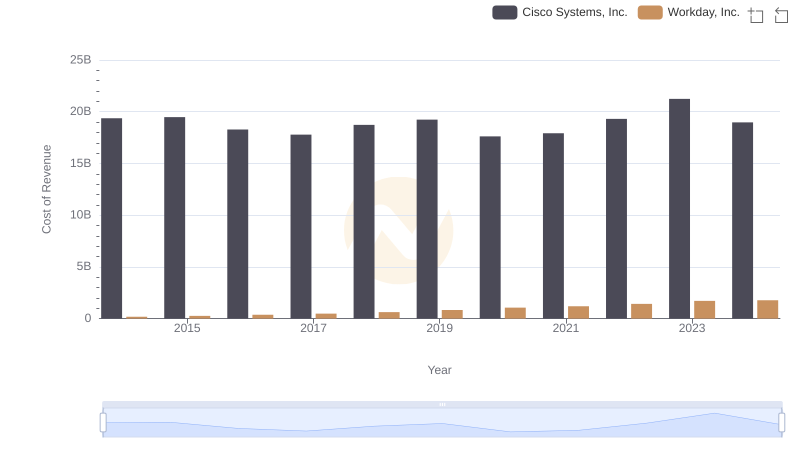
Cost of Revenue: Key Insights for Cisco Systems, Inc. and Workday, Inc.
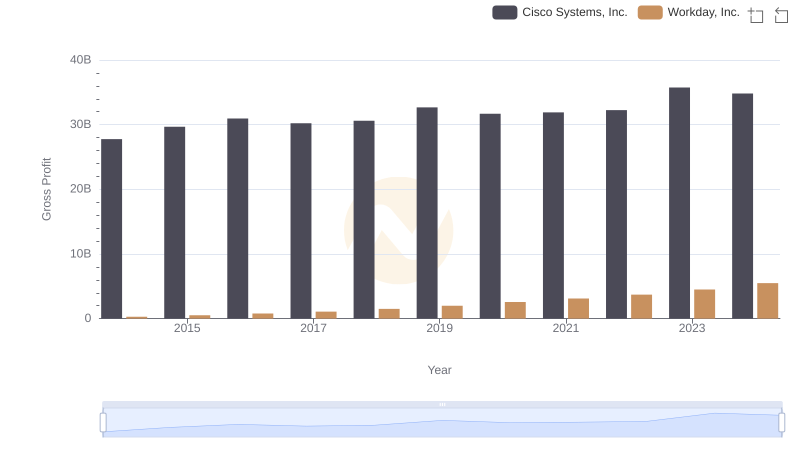
Who Generates Higher Gross Profit? Cisco Systems, Inc. or Workday, Inc.

R&D Spending Showdown: Cisco Systems, Inc. vs Workday, Inc.
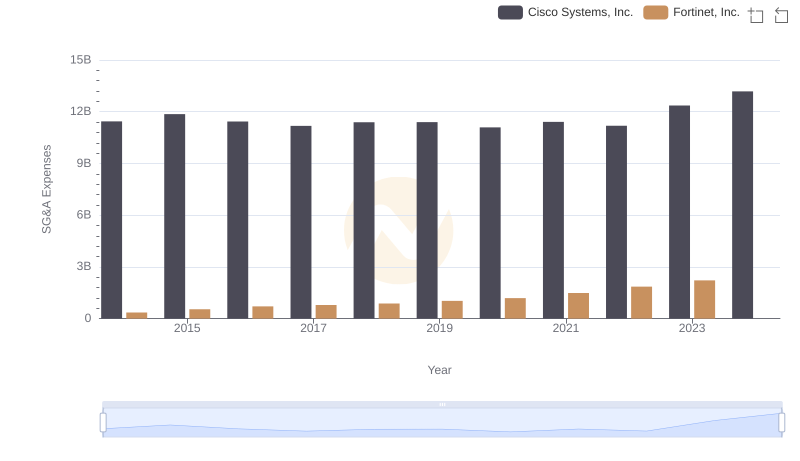
Selling, General, and Administrative Costs: Cisco Systems, Inc. vs Fortinet, Inc.
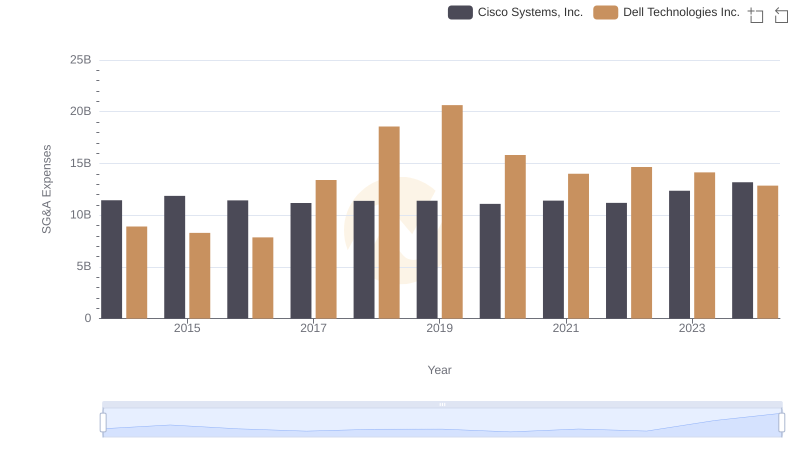
Comparing SG&A Expenses: Cisco Systems, Inc. vs Dell Technologies Inc. Trends and Insights
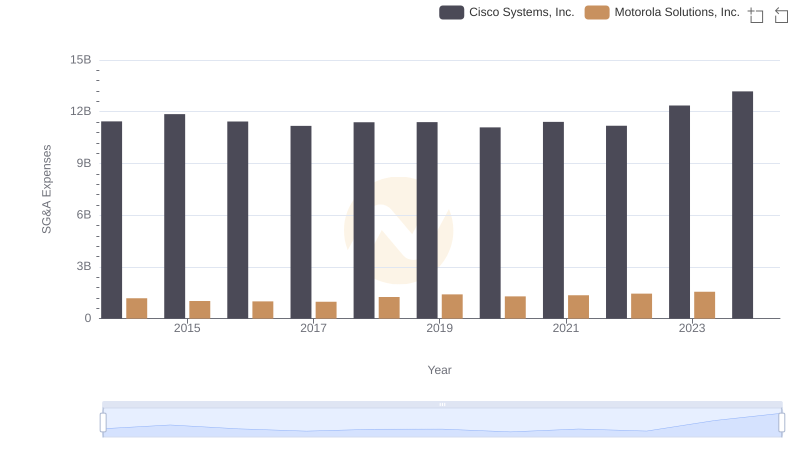
Cisco Systems, Inc. or Motorola Solutions, Inc.: Who Manages SG&A Costs Better?
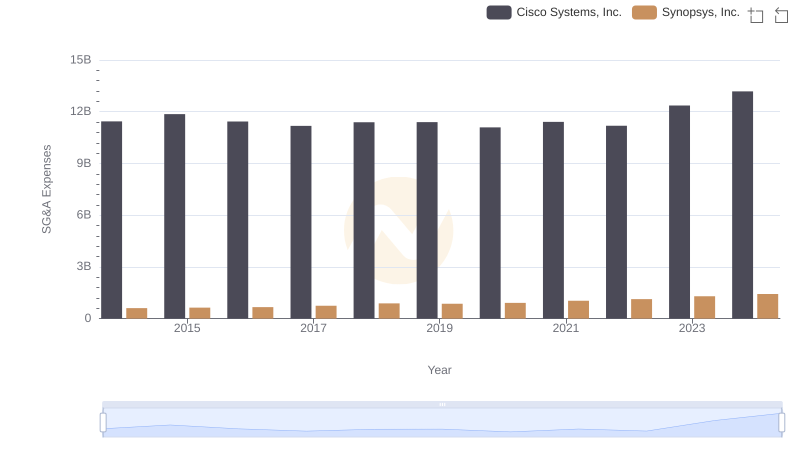
Who Optimizes SG&A Costs Better? Cisco Systems, Inc. or Synopsys, Inc.
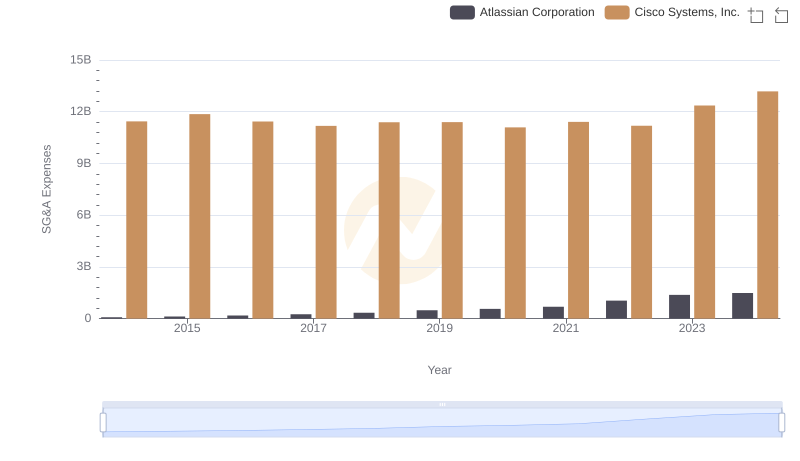
Comparing SG&A Expenses: Cisco Systems, Inc. vs Atlassian Corporation Trends and Insights
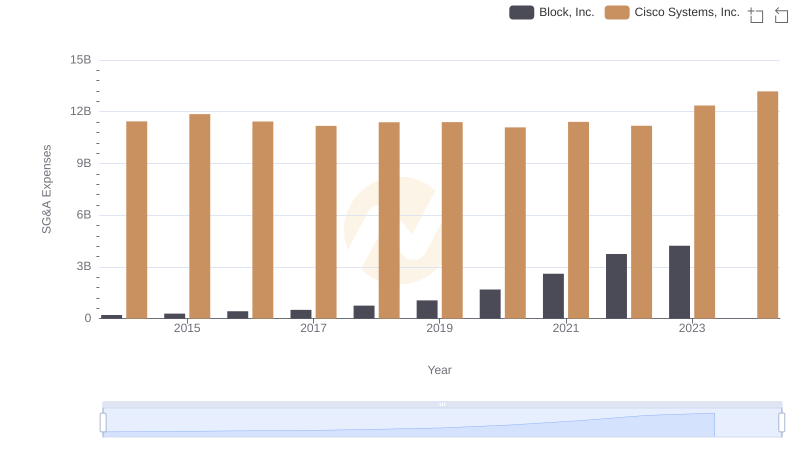
SG&A Efficiency Analysis: Comparing Cisco Systems, Inc. and Block, Inc.
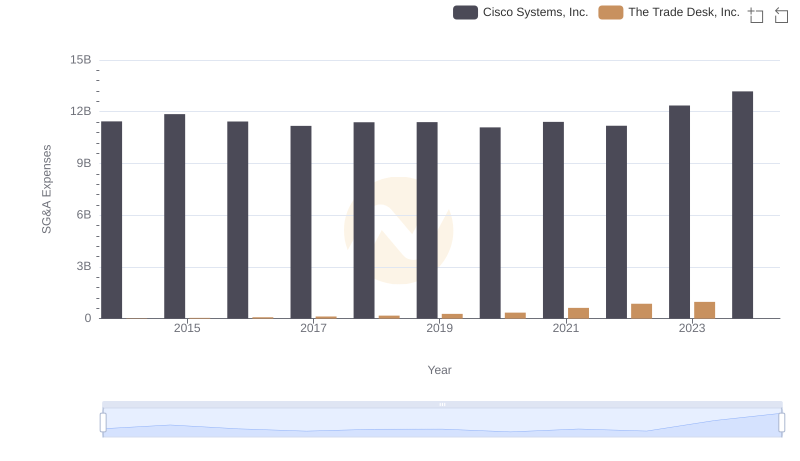
Cost Management Insights: SG&A Expenses for Cisco Systems, Inc. and The Trade Desk, Inc.
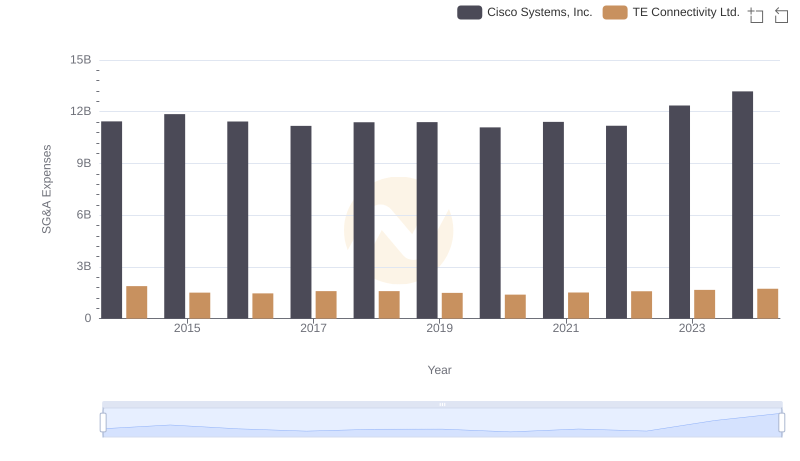
Who Optimizes SG&A Costs Better? Cisco Systems, Inc. or TE Connectivity Ltd.