| __timestamp | Block, Inc. | Cisco Systems, Inc. |
|---|---|---|
| Wednesday, January 1, 2014 | 226074000 | 27769000000 |
| Thursday, January 1, 2015 | 370030000 | 29681000000 |
| Friday, January 1, 2016 | 576038000 | 30960000000 |
| Sunday, January 1, 2017 | 839306000 | 30224000000 |
| Monday, January 1, 2018 | 1303700000 | 30606000000 |
| Tuesday, January 1, 2019 | 1889685000 | 32666000000 |
| Wednesday, January 1, 2020 | 2733409000 | 31683000000 |
| Friday, January 1, 2021 | 4419823000 | 31894000000 |
| Saturday, January 1, 2022 | 5991892000 | 32248000000 |
| Sunday, January 1, 2023 | 7504886000 | 35753000000 |
| Monday, January 1, 2024 | 34828000000 |
In pursuit of knowledge
In the ever-evolving landscape of technology, Cisco Systems, Inc. and Block, Inc. have carved distinct paths. From 2014 to 2023, Cisco consistently demonstrated its prowess with a gross profit that soared by nearly 29%, peaking at over $35 billion in 2023. Meanwhile, Block, Inc., a relatively newer player, showcased impressive growth, with its gross profit skyrocketing by over 3,200% during the same period, reaching approximately $7.5 billion in 2023.
This comparison highlights the contrasting trajectories of a seasoned veteran and a dynamic newcomer. Cisco's steady growth underscores its established market presence, while Block's rapid ascent reflects its innovative approach in the digital payments sector. As we look to the future, the missing data for 2024 invites speculation on how these trends will evolve, offering a captivating narrative for investors and tech enthusiasts alike.
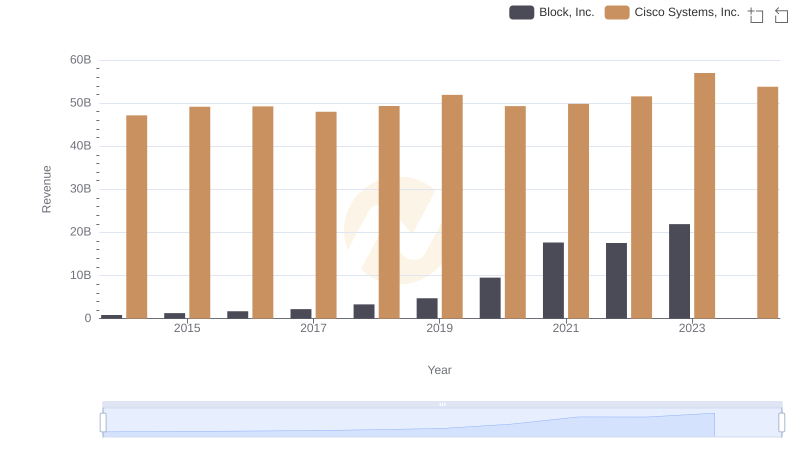
Revenue Insights: Cisco Systems, Inc. and Block, Inc. Performance Compared

Cost of Revenue Comparison: Cisco Systems, Inc. vs Block, Inc.
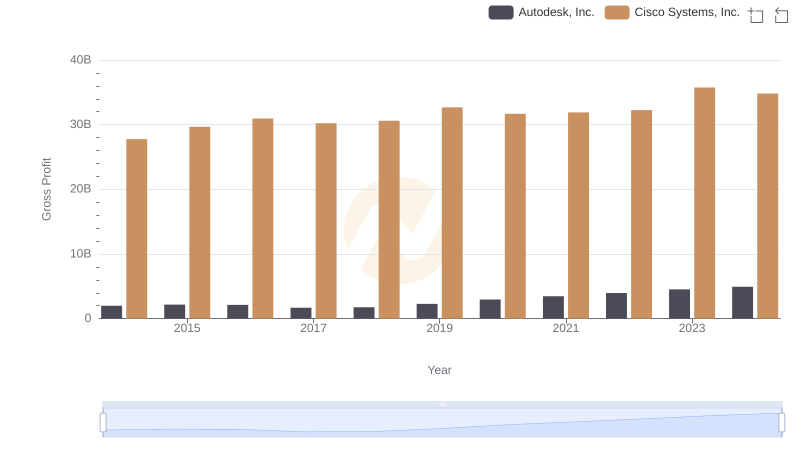
Gross Profit Analysis: Comparing Cisco Systems, Inc. and Autodesk, Inc.
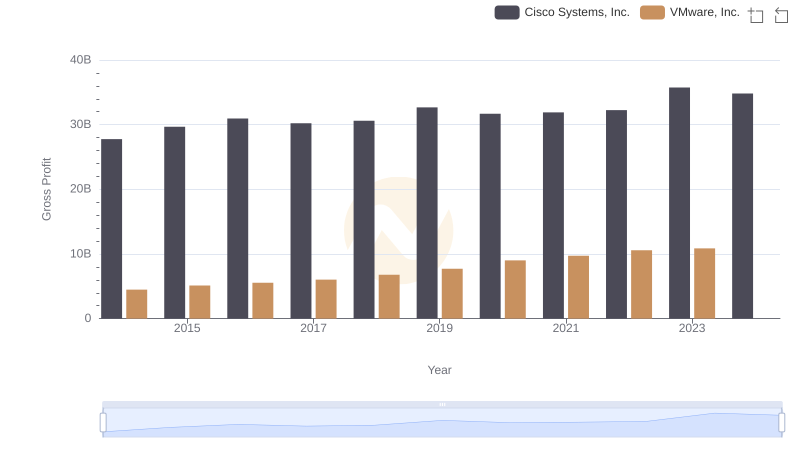
Cisco Systems, Inc. vs VMware, Inc.: A Gross Profit Performance Breakdown

Gross Profit Analysis: Comparing Cisco Systems, Inc. and The Trade Desk, Inc.
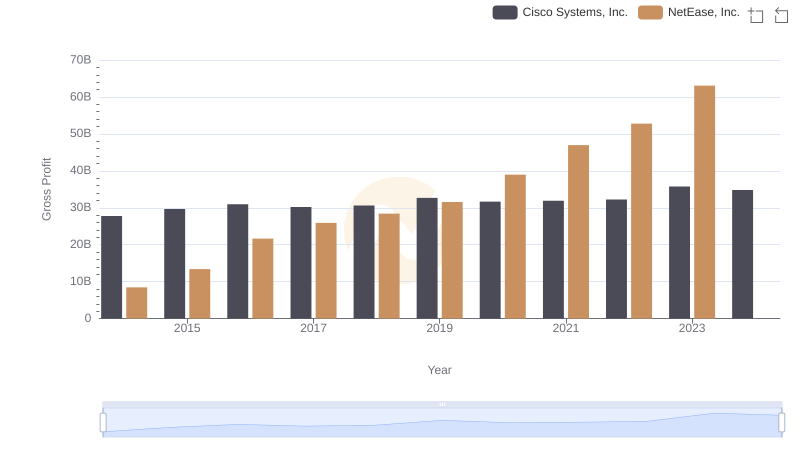
Gross Profit Comparison: Cisco Systems, Inc. and NetEase, Inc. Trends
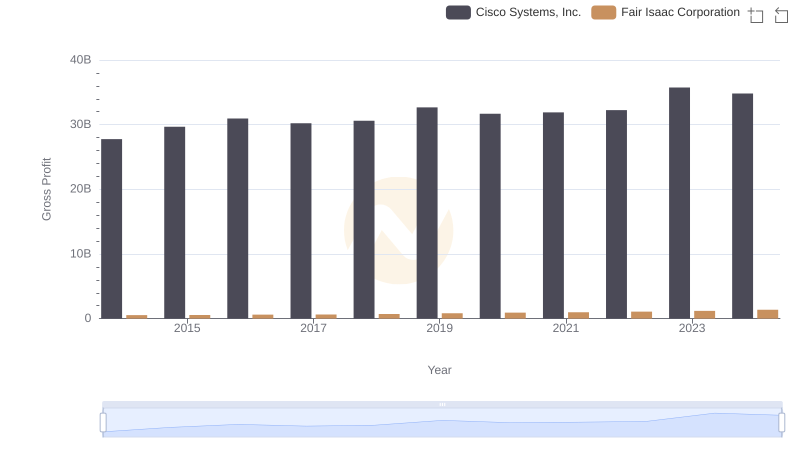
Cisco Systems, Inc. vs Fair Isaac Corporation: A Gross Profit Performance Breakdown
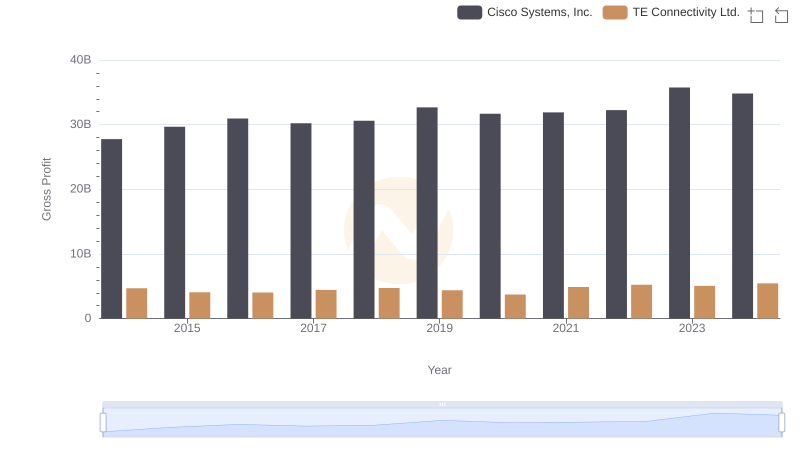
Who Generates Higher Gross Profit? Cisco Systems, Inc. or TE Connectivity Ltd.
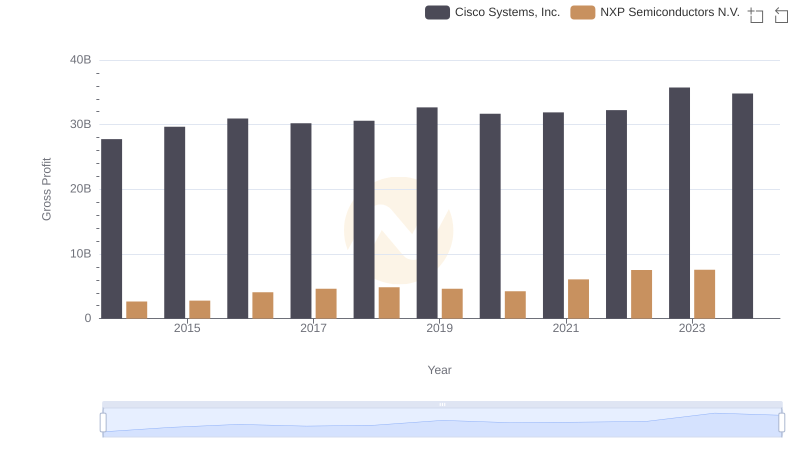
Key Insights on Gross Profit: Cisco Systems, Inc. vs NXP Semiconductors N.V.

Comparing Innovation Spending: Cisco Systems, Inc. and Block, Inc.
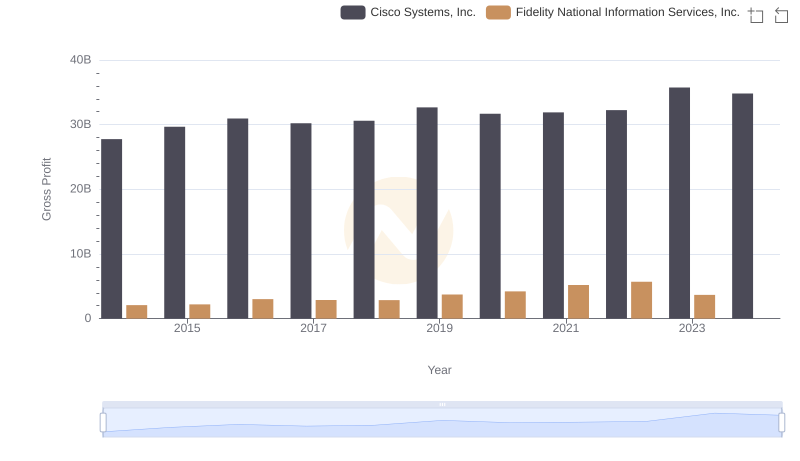
Cisco Systems, Inc. and Fidelity National Information Services, Inc.: A Detailed Gross Profit Analysis
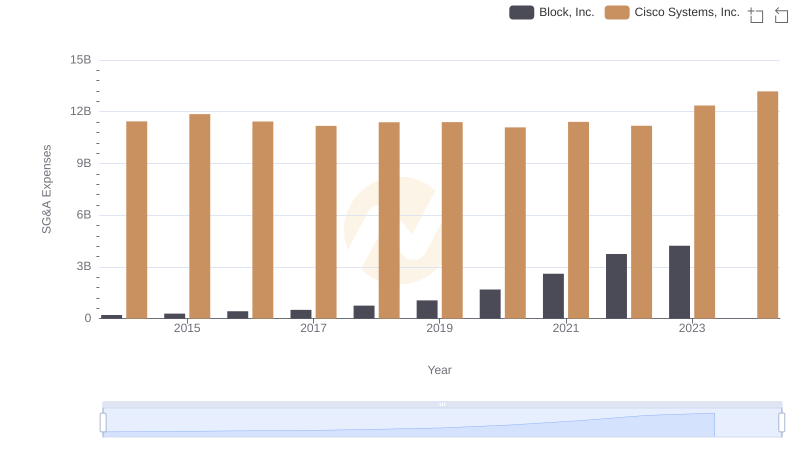
SG&A Efficiency Analysis: Comparing Cisco Systems, Inc. and Block, Inc.