| __timestamp | American Airlines Group Inc. | Automatic Data Processing, Inc. |
|---|---|---|
| Wednesday, January 1, 2014 | 31939000000 | 7221400000 |
| Thursday, January 1, 2015 | 27967000000 | 6427600000 |
| Friday, January 1, 2016 | 28339000000 | 6840300000 |
| Sunday, January 1, 2017 | 31154000000 | 7269800000 |
| Monday, January 1, 2018 | 34490000000 | 7842600000 |
| Tuesday, January 1, 2019 | 35379000000 | 8086600000 |
| Wednesday, January 1, 2020 | 24933000000 | 8445100000 |
| Friday, January 1, 2021 | 29855000000 | 8640300000 |
| Saturday, January 1, 2022 | 39934000000 | 9461900000 |
| Sunday, January 1, 2023 | 40978000000 | 9953400000 |
| Monday, January 1, 2024 | 10476700000 |
Unlocking the unknown
In the ever-evolving landscape of American business, Automatic Data Processing, Inc. (ADP) and American Airlines Group Inc. (AAL) stand as titans in their respective industries. From 2014 to 2023, these companies have showcased contrasting trajectories in their cost of revenue, a critical financial metric that reflects the direct costs attributable to the production of goods sold by a company.
American Airlines experienced a notable 28% increase in its cost of revenue, peaking in 2023. This surge underscores the airline industry's volatile nature, influenced by fluctuating fuel prices and operational challenges. In contrast, ADP, a leader in human resources management, saw a steady 38% rise over the same period, reflecting its consistent growth and adaptation to technological advancements.
While 2024 data for American Airlines remains elusive, ADP's continued upward trend suggests a promising future. As these giants navigate the complexities of their industries, their financial strategies offer valuable insights into resilience and adaptation.
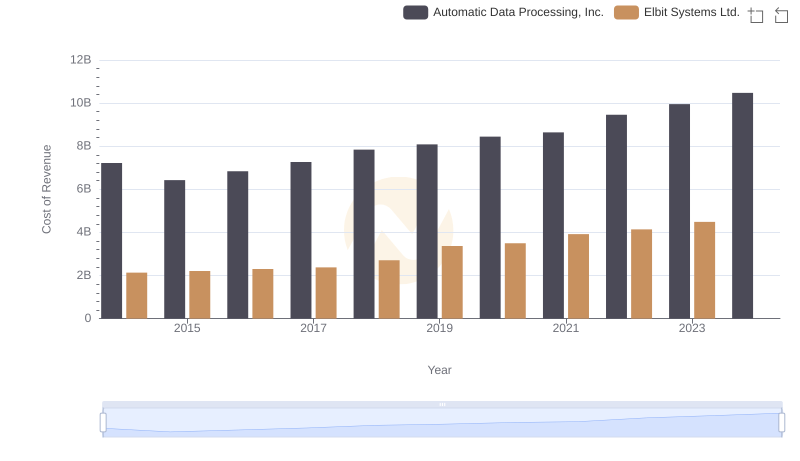
Automatic Data Processing, Inc. vs Elbit Systems Ltd.: Efficiency in Cost of Revenue Explored
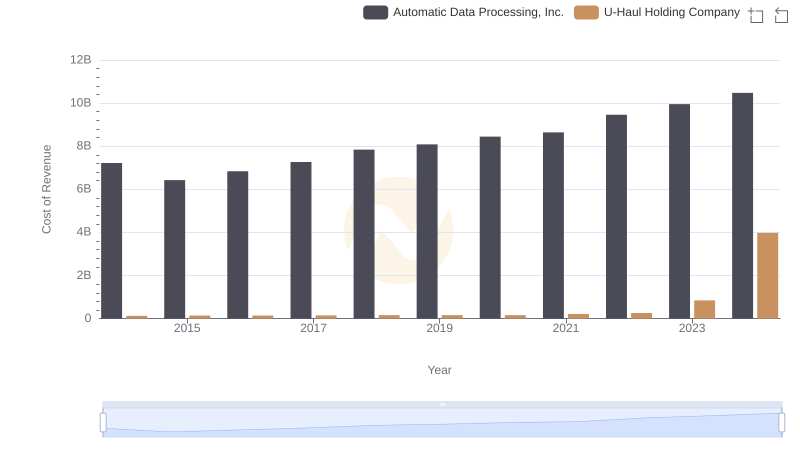
Cost of Revenue Trends: Automatic Data Processing, Inc. vs U-Haul Holding Company
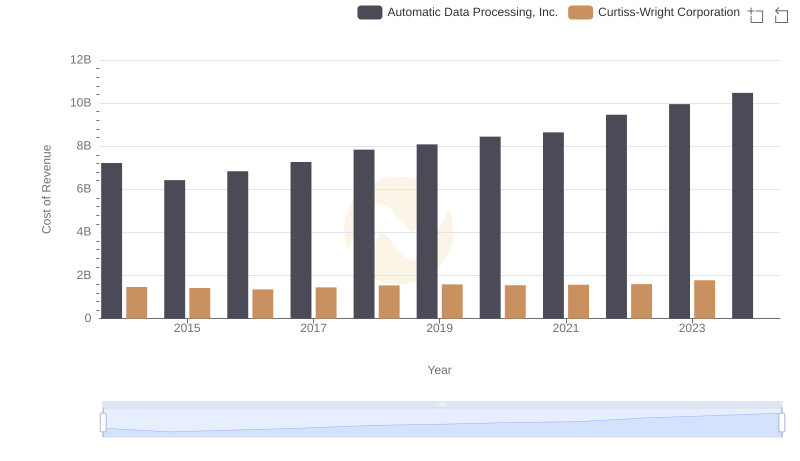
Comparing Cost of Revenue Efficiency: Automatic Data Processing, Inc. vs Curtiss-Wright Corporation
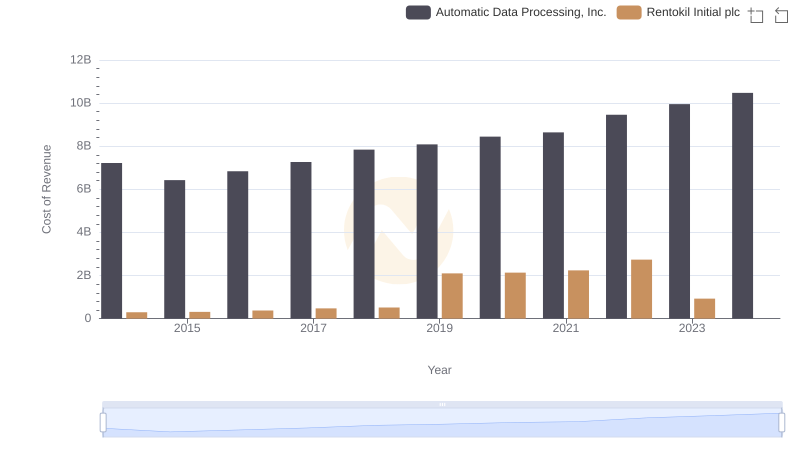
Cost of Revenue Comparison: Automatic Data Processing, Inc. vs Rentokil Initial plc
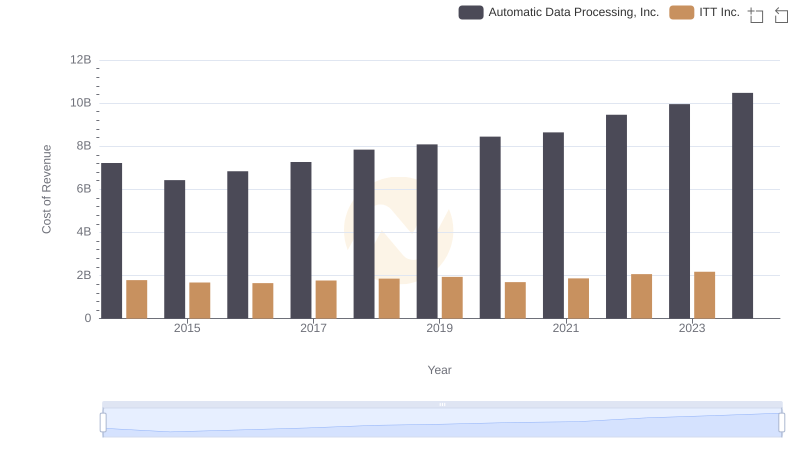
Comparing Cost of Revenue Efficiency: Automatic Data Processing, Inc. vs ITT Inc.
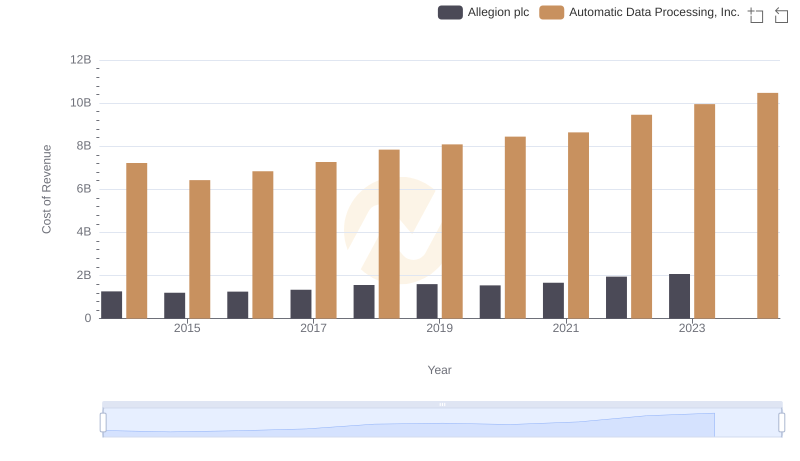
Comparing Cost of Revenue Efficiency: Automatic Data Processing, Inc. vs Allegion plc
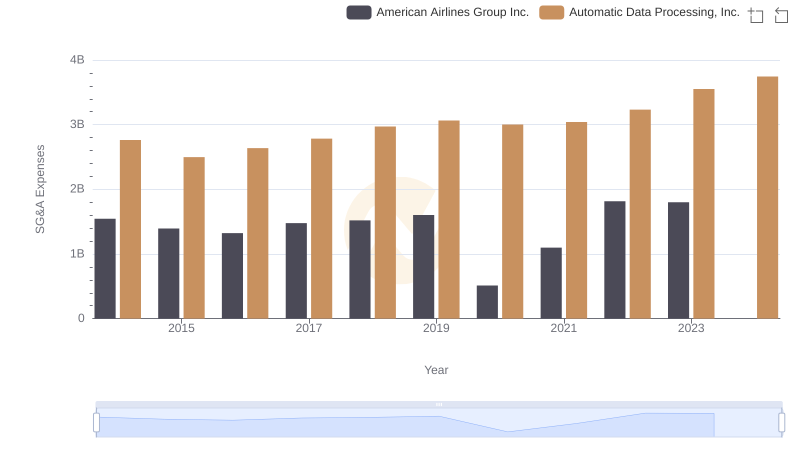
SG&A Efficiency Analysis: Comparing Automatic Data Processing, Inc. and American Airlines Group Inc.