| __timestamp | TransUnion | Westinghouse Air Brake Technologies Corporation |
|---|---|---|
| Wednesday, January 1, 2014 | 1304700000 | 3044454000 |
| Thursday, January 1, 2015 | 1506800000 | 3307998000 |
| Friday, January 1, 2016 | 1704900000 | 2931188000 |
| Sunday, January 1, 2017 | 1933800000 | 3881756000 |
| Monday, January 1, 2018 | 2317200000 | 4363547000 |
| Tuesday, January 1, 2019 | 2656100000 | 8200000000 |
| Wednesday, January 1, 2020 | 2716600000 | 7556100000 |
| Friday, January 1, 2021 | 2960200000 | 7822000000 |
| Saturday, January 1, 2022 | 3709900000 | 8362000000 |
| Sunday, January 1, 2023 | 3831200000 | 9677000000 |
| Monday, January 1, 2024 | 4183800000 | 10387000000 |
Igniting the spark of knowledge
In the ever-evolving landscape of American industry, two giants stand out: Westinghouse Air Brake Technologies Corporation and TransUnion. Over the past decade, these companies have demonstrated remarkable revenue growth, reflecting their resilience and adaptability in a competitive market.
From 2014 to 2023, Westinghouse Air Brake Technologies Corporation saw its revenue soar by over 218%, reaching nearly $9.7 billion in 2023. This growth underscores the company's strategic expansions and innovations in the transportation sector. Meanwhile, TransUnion, a leader in credit reporting, experienced a robust 194% increase in revenue, culminating in approximately $3.8 billion in 2023. This growth highlights the increasing demand for data-driven insights in the financial industry.
These trends not only showcase the companies' individual successes but also reflect broader economic shifts and technological advancements shaping the future of their respective industries.
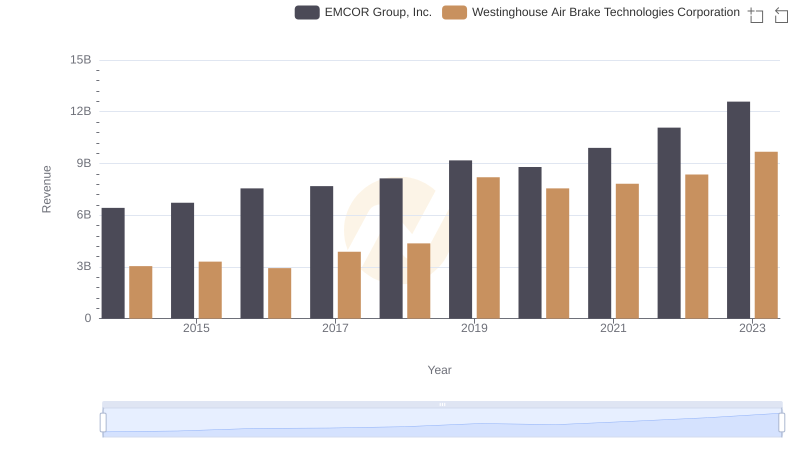
Westinghouse Air Brake Technologies Corporation and EMCOR Group, Inc.: A Comprehensive Revenue Analysis
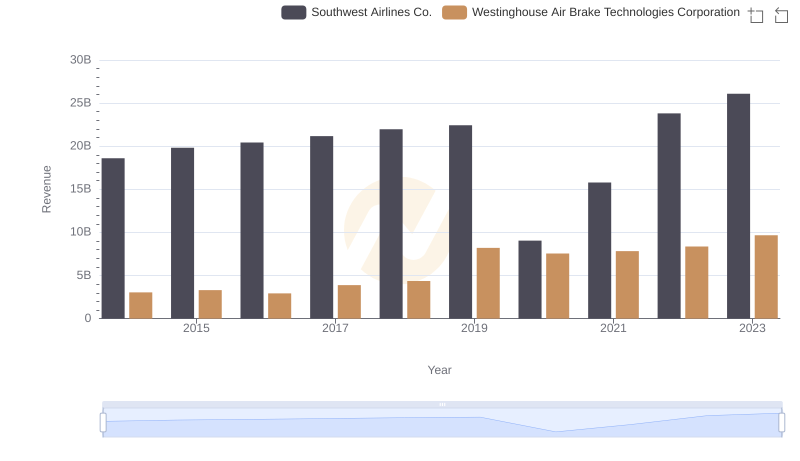
Who Generates More Revenue? Westinghouse Air Brake Technologies Corporation or Southwest Airlines Co.
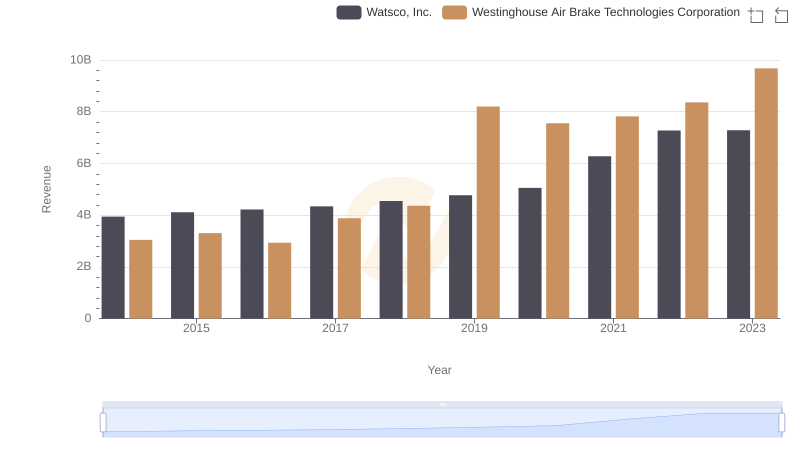
Revenue Insights: Westinghouse Air Brake Technologies Corporation and Watsco, Inc. Performance Compared
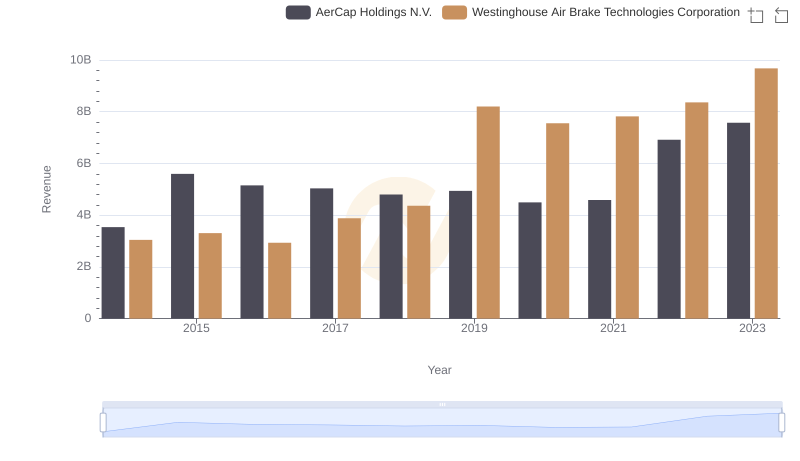
Breaking Down Revenue Trends: Westinghouse Air Brake Technologies Corporation vs AerCap Holdings N.V.
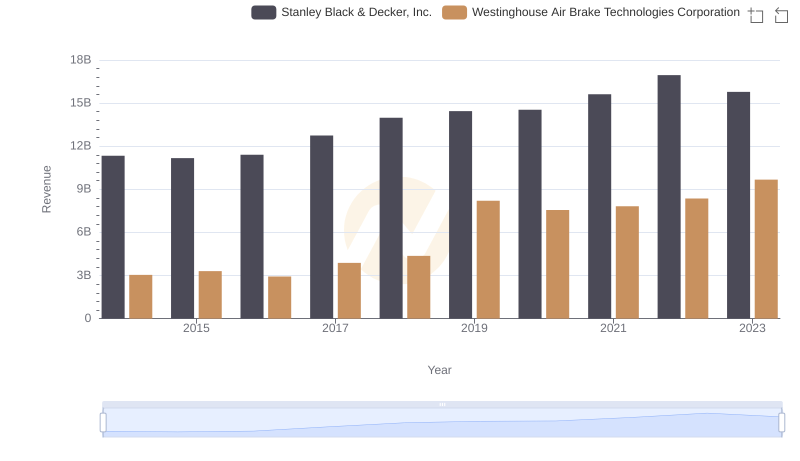
Westinghouse Air Brake Technologies Corporation vs Stanley Black & Decker, Inc.: Examining Key Revenue Metrics

Cost Insights: Breaking Down Westinghouse Air Brake Technologies Corporation and TransUnion's Expenses
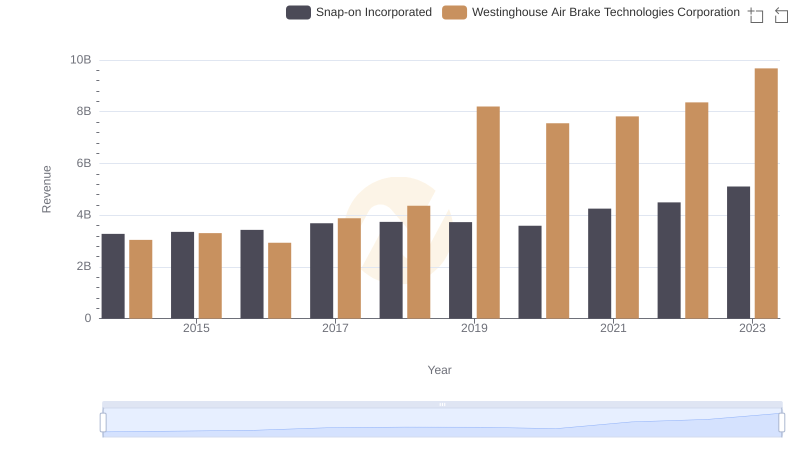
Revenue Insights: Westinghouse Air Brake Technologies Corporation and Snap-on Incorporated Performance Compared
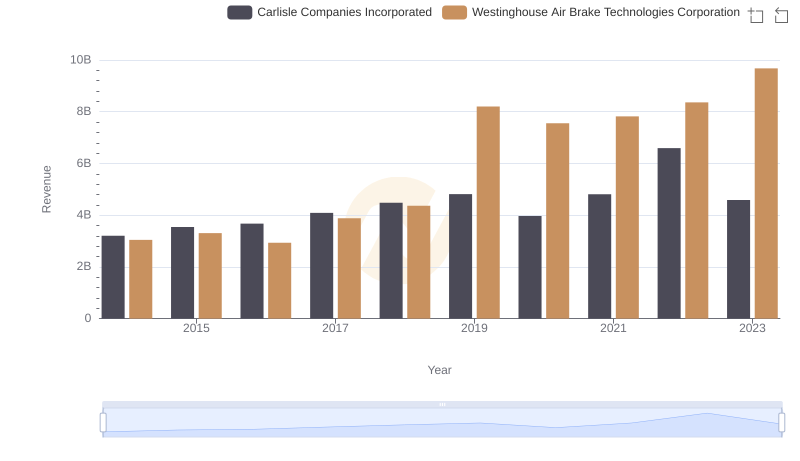
Comparing Revenue Performance: Westinghouse Air Brake Technologies Corporation or Carlisle Companies Incorporated?
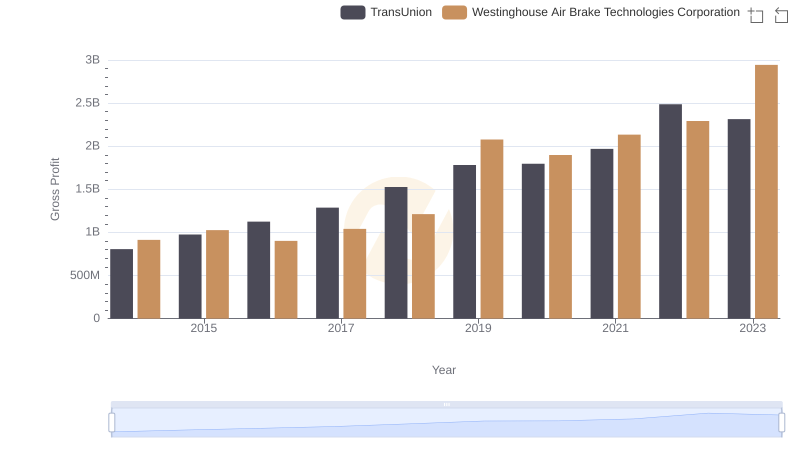
Gross Profit Trends Compared: Westinghouse Air Brake Technologies Corporation vs TransUnion