| __timestamp | Graco Inc. | United Airlines Holdings, Inc. |
|---|---|---|
| Wednesday, January 1, 2014 | 554394000 | 29569000000 |
| Thursday, January 1, 2015 | 601785000 | 25952000000 |
| Friday, January 1, 2016 | 621054000 | 24856000000 |
| Sunday, January 1, 2017 | 681695000 | 27056000000 |
| Monday, January 1, 2018 | 770753000 | 30165000000 |
| Tuesday, January 1, 2019 | 786289000 | 30786000000 |
| Wednesday, January 1, 2020 | 795178000 | 20385000000 |
| Friday, January 1, 2021 | 953659000 | 23913000000 |
| Saturday, January 1, 2022 | 1086082000 | 34315000000 |
| Sunday, January 1, 2023 | 1034585000 | 38518000000 |
| Monday, January 1, 2024 | 990855000 | 37643000000 |
Unveiling the hidden dimensions of data
In the ever-evolving landscape of corporate expenses, United Airlines Holdings, Inc. and Graco Inc. present a fascinating study in contrasts. Over the past decade, United Airlines has consistently grappled with high costs, peaking in 2023 with a staggering 38.5 billion dollars. This represents a 30% increase from its lowest point in 2020, a year marked by unprecedented challenges for the airline industry.
Conversely, Graco Inc., a leader in fluid handling systems, has demonstrated a steady growth trajectory. From 2014 to 2023, Graco's cost of revenue increased by approximately 86%, reaching over 1 billion dollars in 2022. This growth underscores the company's resilience and strategic expansion.
While United Airlines' costs reflect the volatile nature of the aviation sector, Graco's steady rise highlights the stability of industrial manufacturing. These insights offer a window into the financial dynamics shaping two distinct industries.
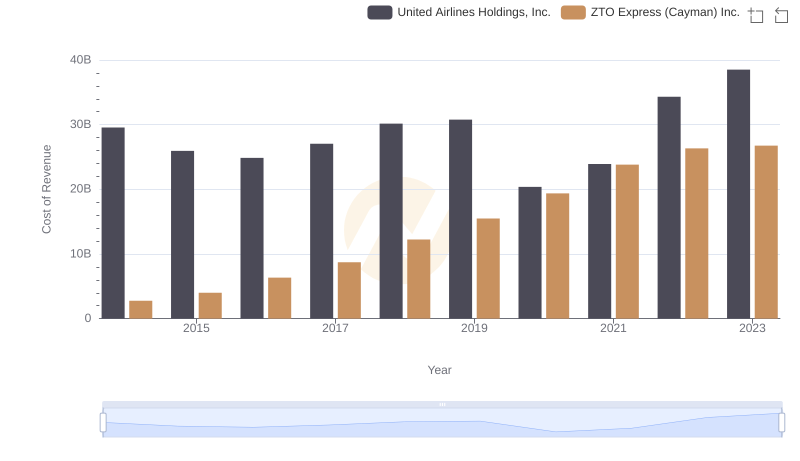
Cost Insights: Breaking Down United Airlines Holdings, Inc. and ZTO Express (Cayman) Inc.'s Expenses
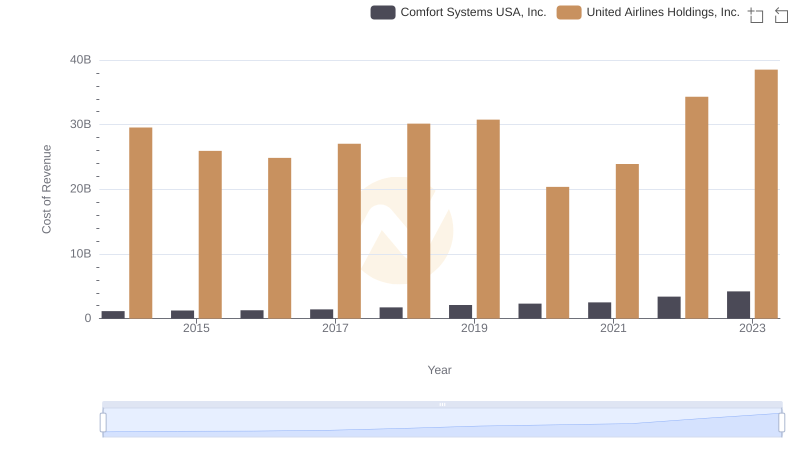
Cost of Revenue: Key Insights for United Airlines Holdings, Inc. and Comfort Systems USA, Inc.
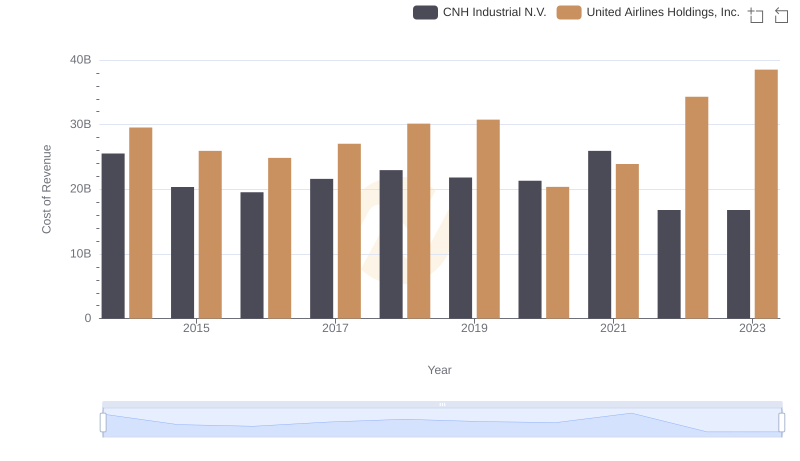
Cost Insights: Breaking Down United Airlines Holdings, Inc. and CNH Industrial N.V.'s Expenses
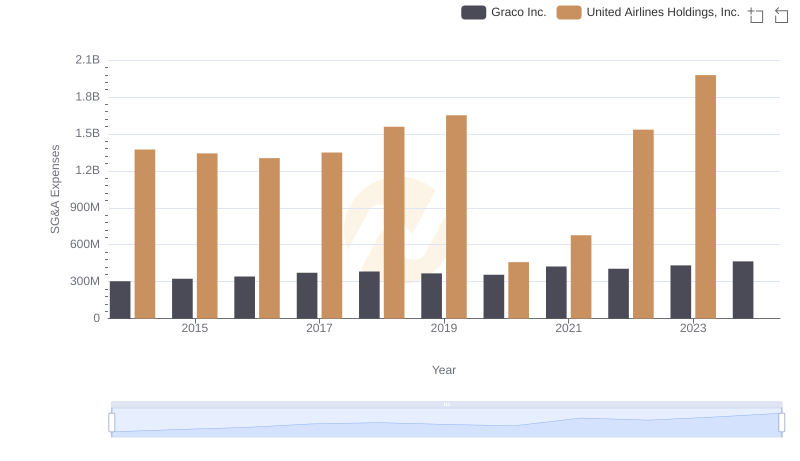
United Airlines Holdings, Inc. or Graco Inc.: Who Manages SG&A Costs Better?