| __timestamp | Trane Technologies plc | Union Pacific Corporation |
|---|---|---|
| Wednesday, January 1, 2014 | 1757000000 | 10808000000 |
| Thursday, January 1, 2015 | 1835000000 | 10290000000 |
| Friday, January 1, 2016 | 2311000000 | 9502000000 |
| Sunday, January 1, 2017 | 1982500000 | 10456000000 |
| Monday, January 1, 2018 | 2242400000 | 10802000000 |
| Tuesday, January 1, 2019 | 1931200000 | 11013000000 |
| Wednesday, January 1, 2020 | 1831900000 | 10331000000 |
| Friday, January 1, 2021 | 2319200000 | 11843000000 |
| Saturday, January 1, 2022 | 2715500000 | 12636000000 |
| Sunday, January 1, 2023 | 3149900000 | 11928000000 |
| Monday, January 1, 2024 | 3859600000 | 12461000000 |
Igniting the spark of knowledge
In the ever-evolving landscape of American industry, Union Pacific Corporation and Trane Technologies plc stand as titans in their respective fields. Over the past decade, from 2014 to 2023, these companies have showcased remarkable financial resilience and growth, as reflected in their EBITDA performance.
Union Pacific, a stalwart in the transportation sector, consistently demonstrated robust EBITDA figures, peaking in 2022 with a 33% increase from its 2016 low. Meanwhile, Trane Technologies, a leader in climate solutions, exhibited a steady upward trajectory, culminating in a 79% rise in EBITDA by 2023 compared to 2014.
This comparative analysis highlights Union Pacific's stable yet impressive growth, while Trane Technologies' dynamic expansion underscores its adaptability in a rapidly changing market. As we look to the future, these trends offer valuable insights into the strategic directions of these industry giants.
Note: Data for 2024 is incomplete for Trane Technologies.

Cost Insights: Breaking Down Union Pacific Corporation and Trane Technologies plc's Expenses
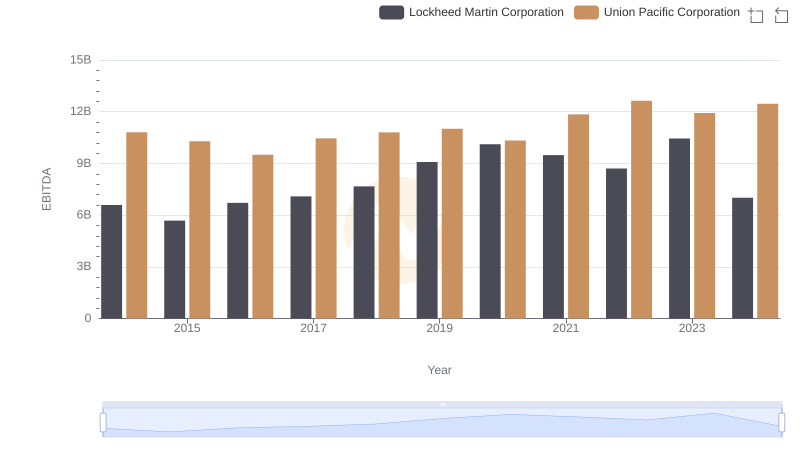
Comparative EBITDA Analysis: Union Pacific Corporation vs Lockheed Martin Corporation

EBITDA Performance Review: Union Pacific Corporation vs Deere & Company
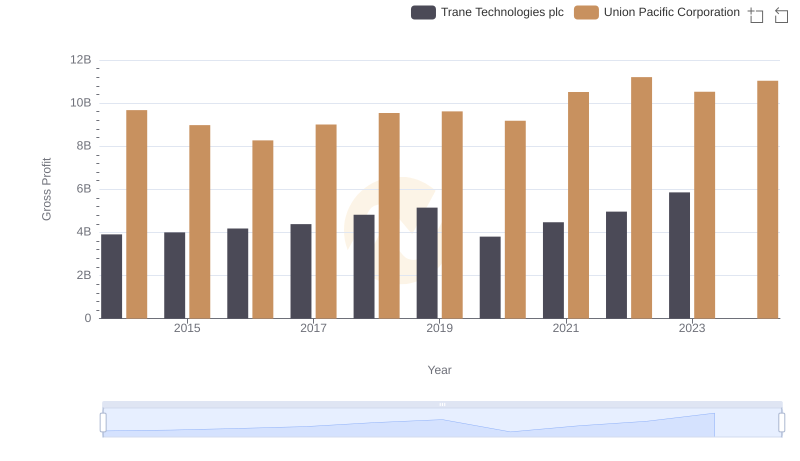
Union Pacific Corporation vs Trane Technologies plc: A Gross Profit Performance Breakdown
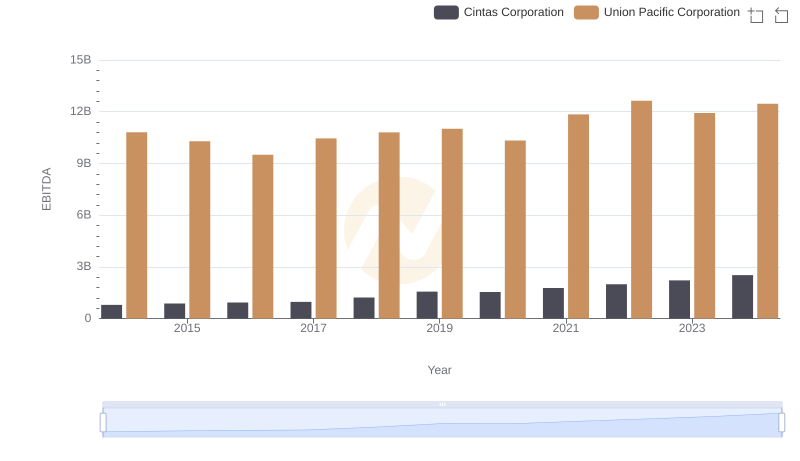
A Side-by-Side Analysis of EBITDA: Union Pacific Corporation and Cintas Corporation