| __timestamp | Carlisle Companies Incorporated | Global Payments Inc. |
|---|---|---|
| Wednesday, January 1, 2014 | 2384500000 | 1022107000 |
| Thursday, January 1, 2015 | 2536500000 | 1147639000 |
| Friday, January 1, 2016 | 2518100000 | 1603532000 |
| Sunday, January 1, 2017 | 2941900000 | 1928037000 |
| Monday, January 1, 2018 | 3304800000 | 1095014000 |
| Tuesday, January 1, 2019 | 3439900000 | 2073803000 |
| Wednesday, January 1, 2020 | 2832500000 | 3650727000 |
| Friday, January 1, 2021 | 3495600000 | 3773725000 |
| Saturday, January 1, 2022 | 4434500000 | 3778617000 |
| Sunday, January 1, 2023 | 3042900000 | 3727521000 |
| Monday, January 1, 2024 | 3115900000 | 3760116000 |
Igniting the spark of knowledge
In the ever-evolving landscape of corporate finance, understanding the cost of revenue is crucial for assessing a company's efficiency and profitability. This chart provides a fascinating comparison between Global Payments Inc. and Carlisle Companies Incorporated from 2014 to 2023.
Over the past decade, Carlisle Companies Incorporated has consistently maintained a higher cost of revenue compared to Global Payments Inc. Notably, in 2022, Carlisle's cost of revenue peaked at approximately 4.43 billion, marking a 56% increase from 2014. In contrast, Global Payments Inc. saw a significant rise in its cost of revenue, reaching around 3.78 billion in 2022, a staggering 270% increase from its 2014 figures.
This data highlights the strategic differences between the two companies. While Carlisle's cost of revenue shows steady growth, Global Payments Inc. demonstrates a more volatile yet rapid increase, reflecting its aggressive expansion strategies in the financial services sector.

Global Payments Inc. vs EMCOR Group, Inc.: Efficiency in Cost of Revenue Explored
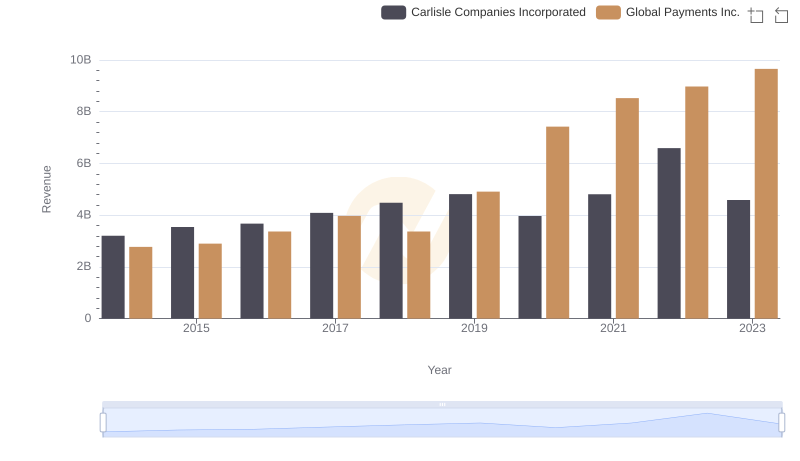
Global Payments Inc. vs Carlisle Companies Incorporated: Examining Key Revenue Metrics
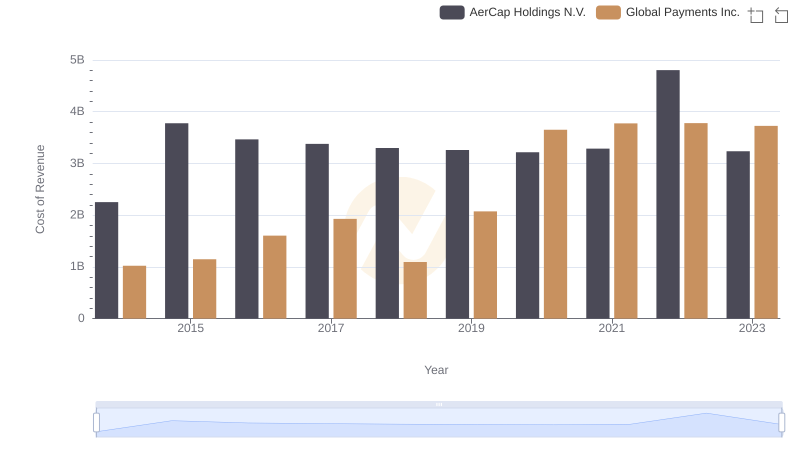
Cost of Revenue: Key Insights for Global Payments Inc. and AerCap Holdings N.V.
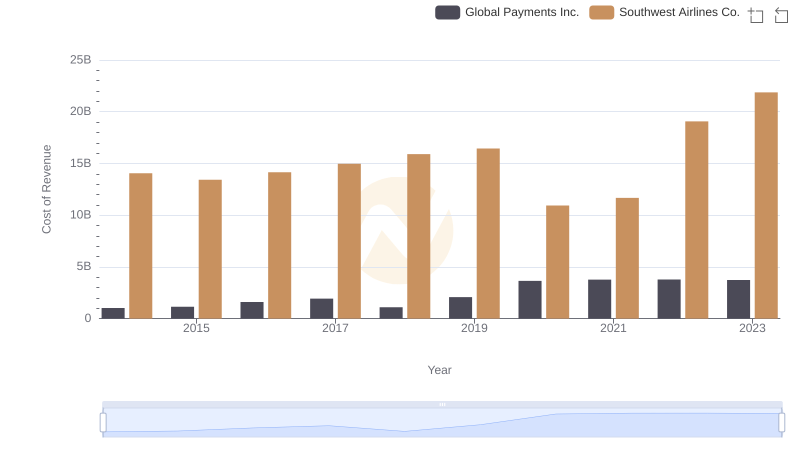
Analyzing Cost of Revenue: Global Payments Inc. and Southwest Airlines Co.
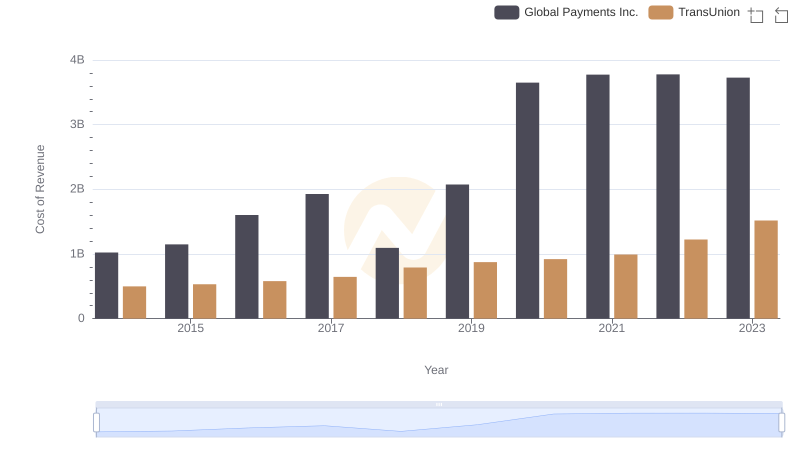
Cost of Revenue Trends: Global Payments Inc. vs TransUnion
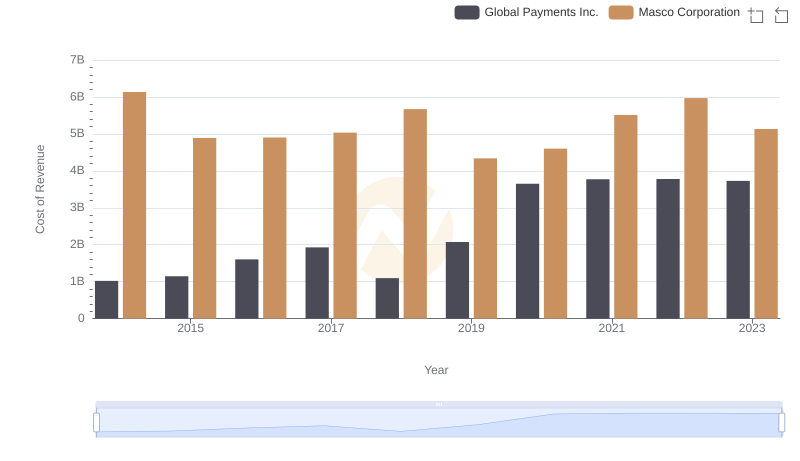
Analyzing Cost of Revenue: Global Payments Inc. and Masco Corporation
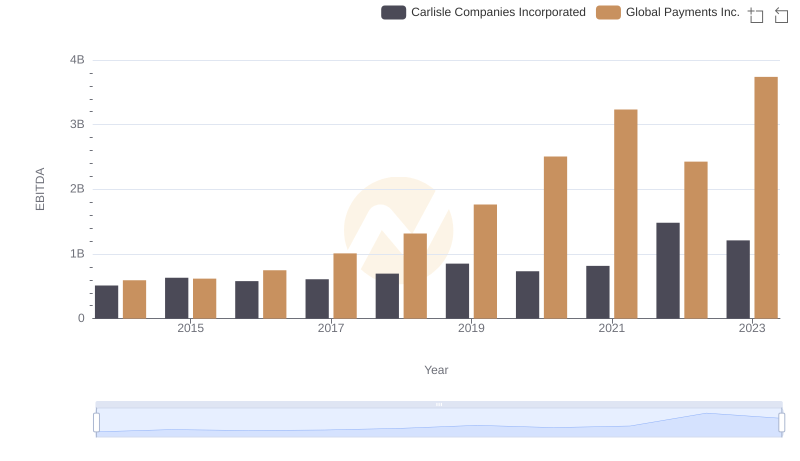
EBITDA Analysis: Evaluating Global Payments Inc. Against Carlisle Companies Incorporated