| __timestamp | Nordson Corporation | Old Dominion Freight Line, Inc. |
|---|---|---|
| Wednesday, January 1, 2014 | 1704021000 | 2787897000 |
| Thursday, January 1, 2015 | 1688666000 | 2972442000 |
| Friday, January 1, 2016 | 1808994000 | 2991517000 |
| Sunday, January 1, 2017 | 2066982000 | 3358112000 |
| Monday, January 1, 2018 | 2254668000 | 4043695000 |
| Tuesday, January 1, 2019 | 2194226000 | 4109111000 |
| Wednesday, January 1, 2020 | 2121100000 | 4015129000 |
| Friday, January 1, 2021 | 2362209000 | 5256328000 |
| Saturday, January 1, 2022 | 2590278000 | 6260077000 |
| Sunday, January 1, 2023 | 2628632000 | 5866152000 |
| Monday, January 1, 2024 | 2689921000 |
Infusing magic into the data realm
In the ever-evolving landscape of American industry, Old Dominion Freight Line, Inc. and Nordson Corporation stand as titans in their respective fields. Over the past decade, these companies have showcased remarkable revenue growth, reflecting their resilience and adaptability.
From 2014 to 2023, Old Dominion Freight Line, a leader in the freight and logistics sector, saw its revenue soar by approximately 110%, peaking in 2022. Meanwhile, Nordson Corporation, a key player in precision technology, experienced a steady revenue increase of around 58% over the same period. Notably, Old Dominion's revenue growth outpaced Nordson's, highlighting its robust expansion strategy.
While Nordson's 2024 data shows continued growth, Old Dominion's figures remain elusive, leaving industry analysts eager for updates. This gap underscores the dynamic nature of market conditions and the importance of timely data in strategic planning.
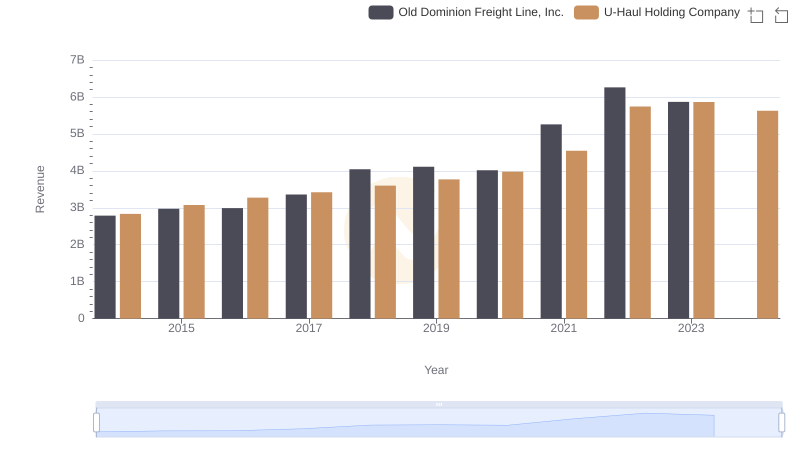
Old Dominion Freight Line, Inc. or U-Haul Holding Company: Who Leads in Yearly Revenue?
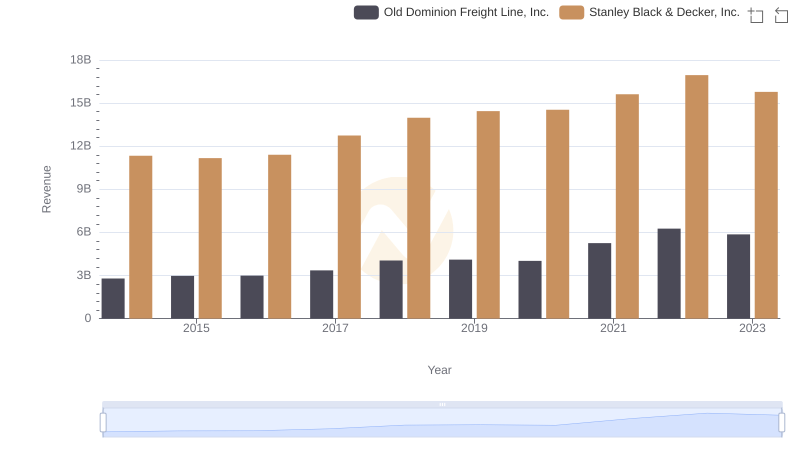
Old Dominion Freight Line, Inc. vs Stanley Black & Decker, Inc.: Annual Revenue Growth Compared
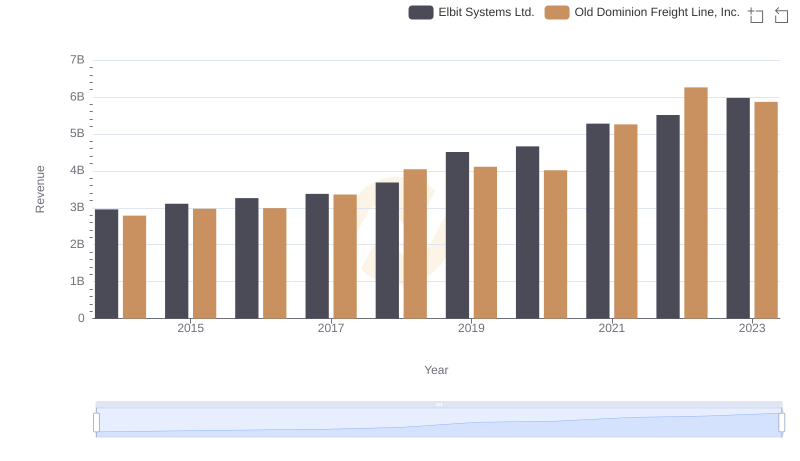
Old Dominion Freight Line, Inc. vs Elbit Systems Ltd.: Annual Revenue Growth Compared
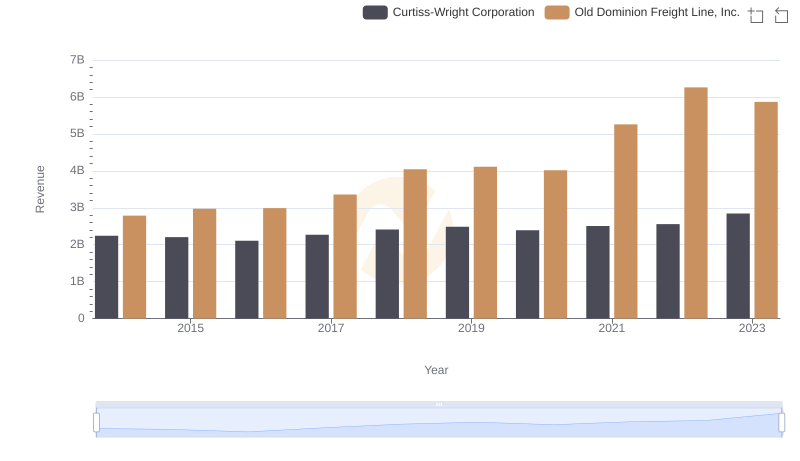
Annual Revenue Comparison: Old Dominion Freight Line, Inc. vs Curtiss-Wright Corporation
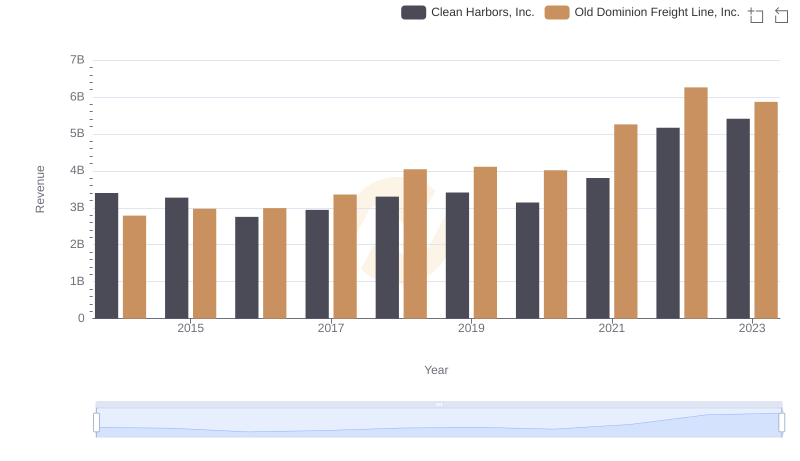
Breaking Down Revenue Trends: Old Dominion Freight Line, Inc. vs Clean Harbors, Inc.
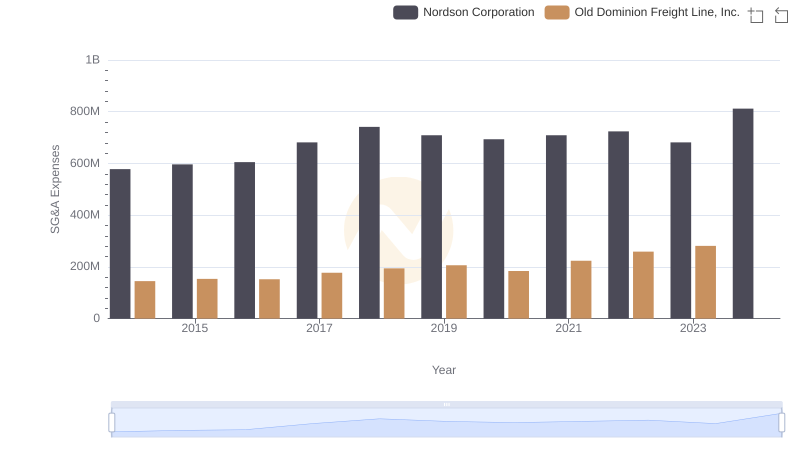
Breaking Down SG&A Expenses: Old Dominion Freight Line, Inc. vs Nordson Corporation
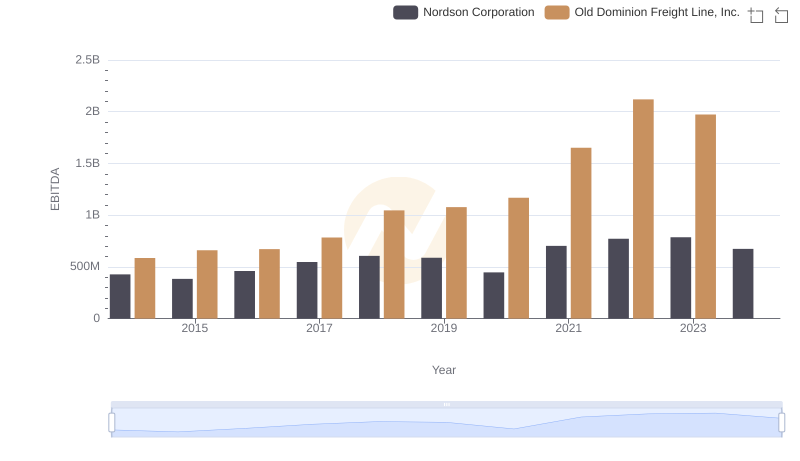
Comprehensive EBITDA Comparison: Old Dominion Freight Line, Inc. vs Nordson Corporation