| __timestamp | Adobe Inc. | Trimble Inc. |
|---|---|---|
| Wednesday, January 1, 2014 | 2215140000 | 634689000 |
| Thursday, January 1, 2015 | 2215161000 | 629900000 |
| Friday, January 1, 2016 | 2487907000 | 633600000 |
| Sunday, January 1, 2017 | 2822298000 | 706500000 |
| Monday, January 1, 2018 | 3365727000 | 829600000 |
| Tuesday, January 1, 2019 | 4124984000 | 834800000 |
| Wednesday, January 1, 2020 | 4559000000 | 767900000 |
| Friday, January 1, 2021 | 5406000000 | 875900000 |
| Saturday, January 1, 2022 | 6187000000 | 975800000 |
| Sunday, January 1, 2023 | 6764000000 | 1070500000 |
| Monday, January 1, 2024 | 7293000000 |
Infusing magic into the data realm
In the ever-evolving landscape of technology, understanding a company's operational efficiency is crucial. Adobe Inc. and Trimble Inc., two giants in their respective fields, offer a fascinating study in SG&A (Selling, General, and Administrative) expenses over the past decade. Adobe's SG&A expenses have surged by approximately 230% from 2014 to 2023, reflecting its aggressive growth strategy and market expansion. In contrast, Trimble's expenses have grown by about 68% in the same period, indicating a more conservative approach.
Adobe's expenses peaked in 2024, while Trimble's data for the same year remains elusive, hinting at potential strategic shifts. This comparison not only highlights their differing growth trajectories but also underscores the importance of efficient resource allocation in maintaining competitive advantage. As we look to the future, these trends offer valuable insights into the strategic priorities of these industry leaders.
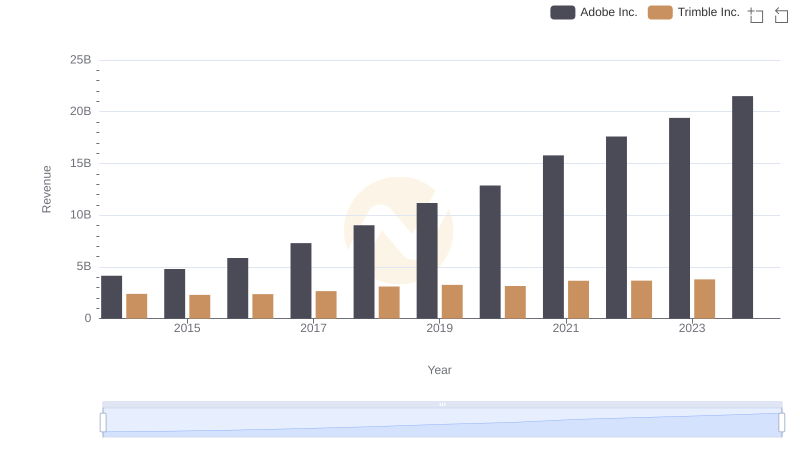
Breaking Down Revenue Trends: Adobe Inc. vs Trimble Inc.
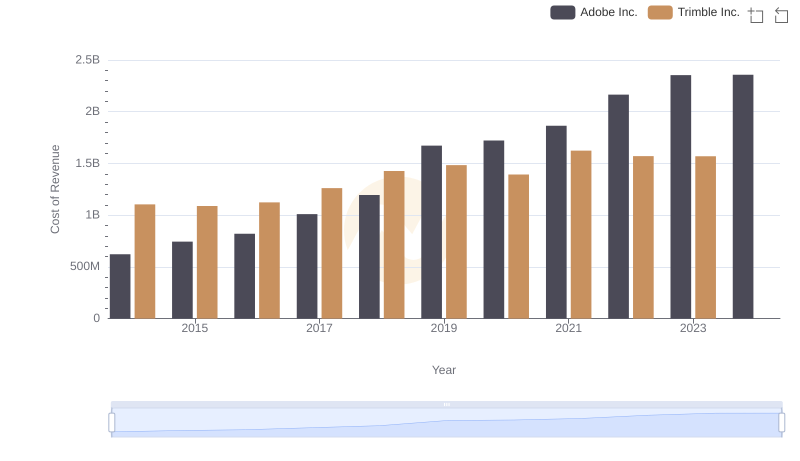
Cost Insights: Breaking Down Adobe Inc. and Trimble Inc.'s Expenses
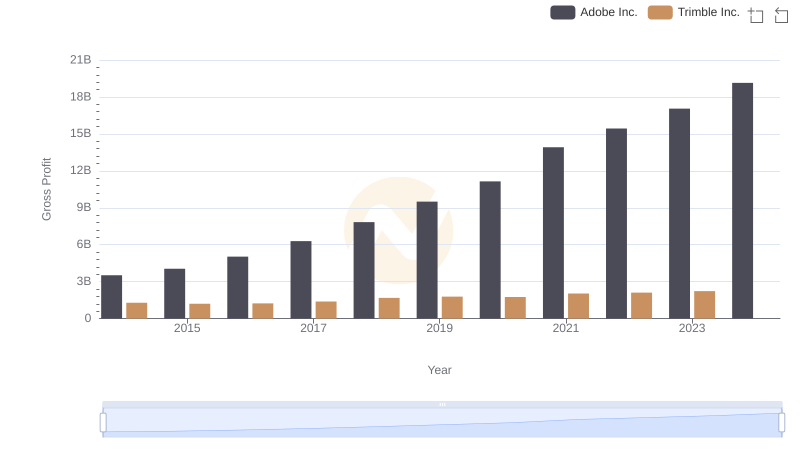
Who Generates Higher Gross Profit? Adobe Inc. or Trimble Inc.
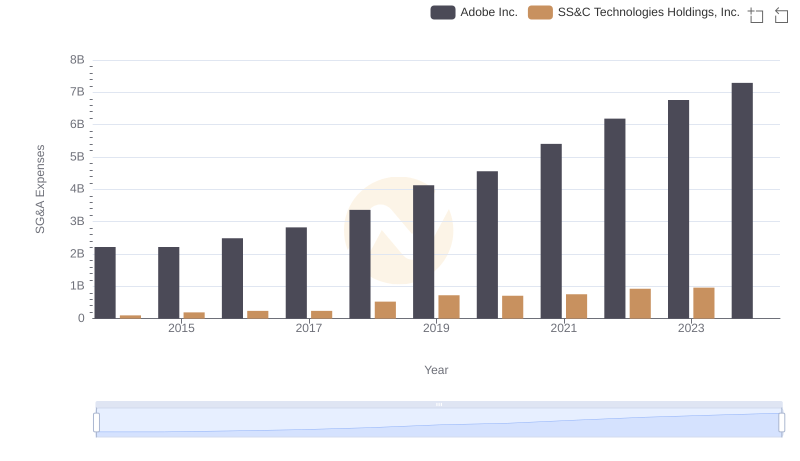
Comparing SG&A Expenses: Adobe Inc. vs SS&C Technologies Holdings, Inc. Trends and Insights
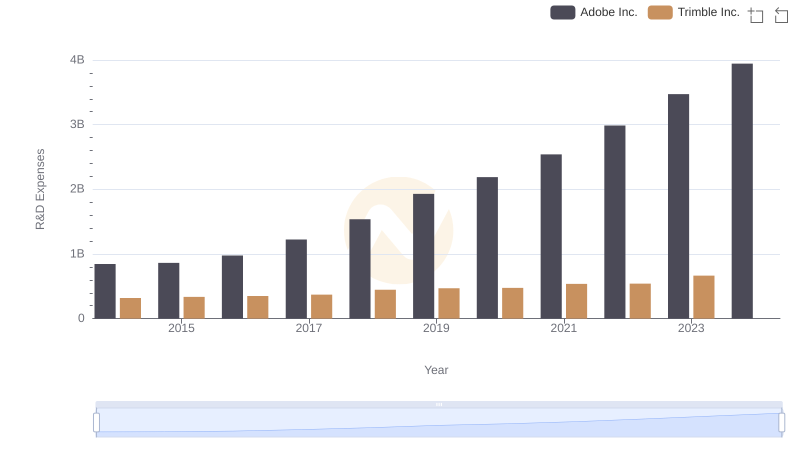
R&D Spending Showdown: Adobe Inc. vs Trimble Inc.
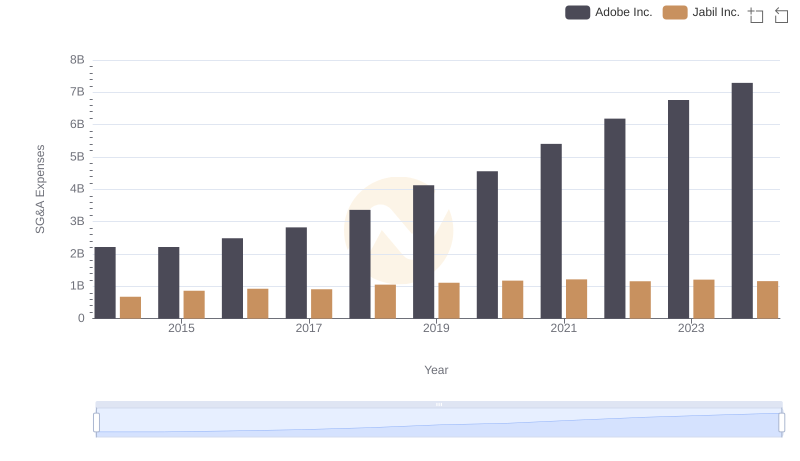
Breaking Down SG&A Expenses: Adobe Inc. vs Jabil Inc.
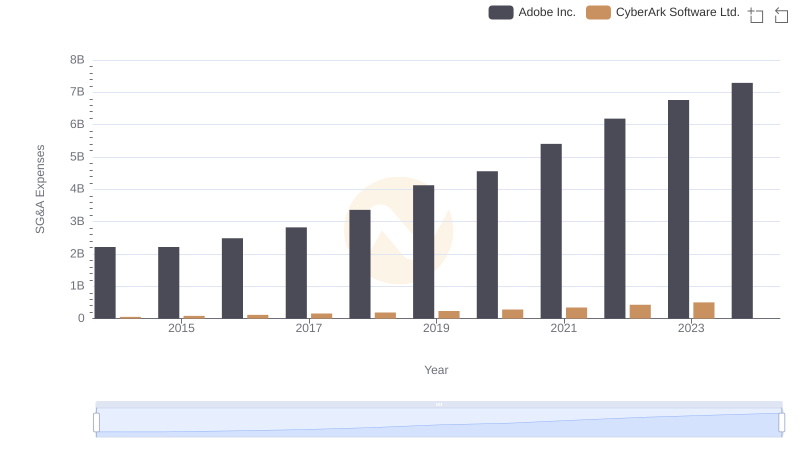
Adobe Inc. or CyberArk Software Ltd.: Who Manages SG&A Costs Better?
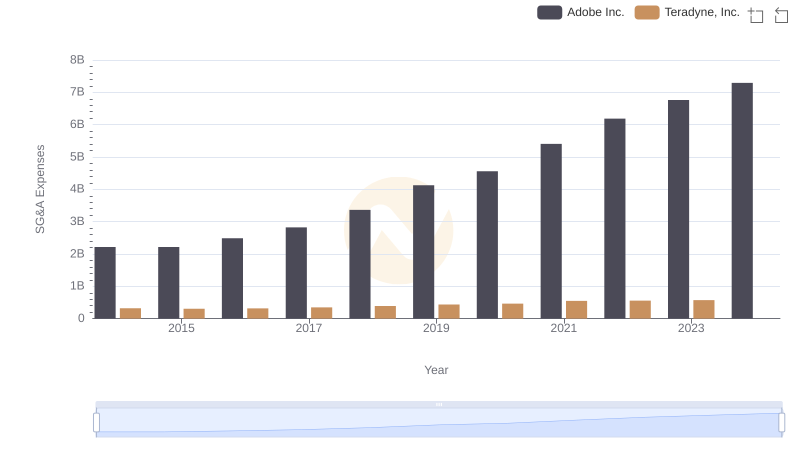
Breaking Down SG&A Expenses: Adobe Inc. vs Teradyne, Inc.
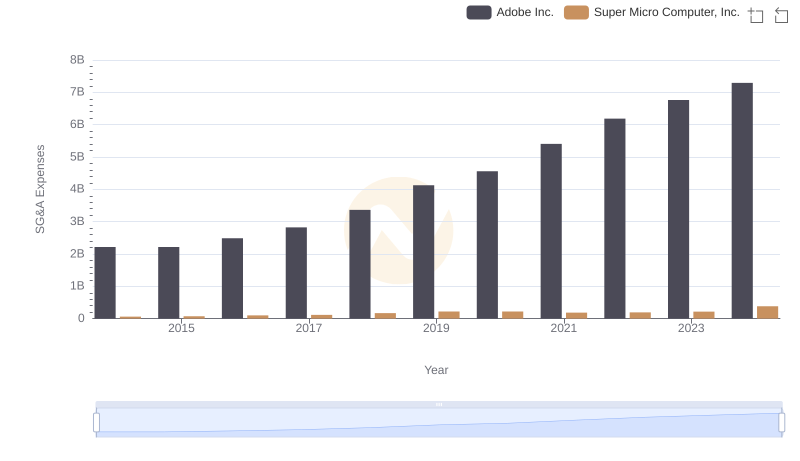
Who Optimizes SG&A Costs Better? Adobe Inc. or Super Micro Computer, Inc.
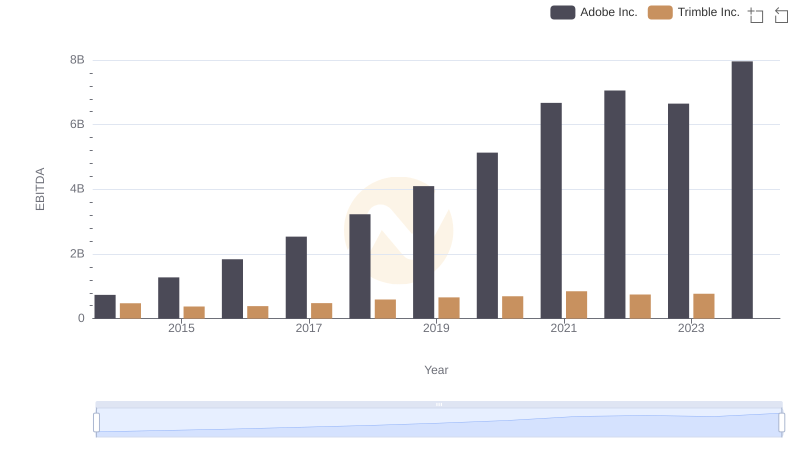
Professional EBITDA Benchmarking: Adobe Inc. vs Trimble Inc.
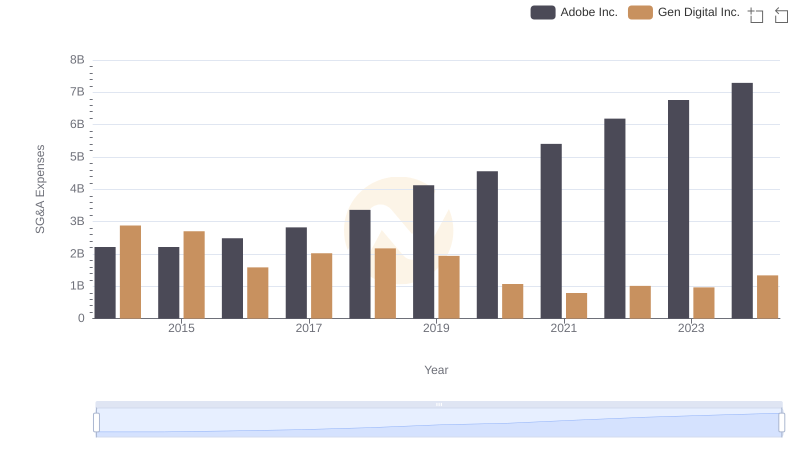
Cost Management Insights: SG&A Expenses for Adobe Inc. and Gen Digital Inc.
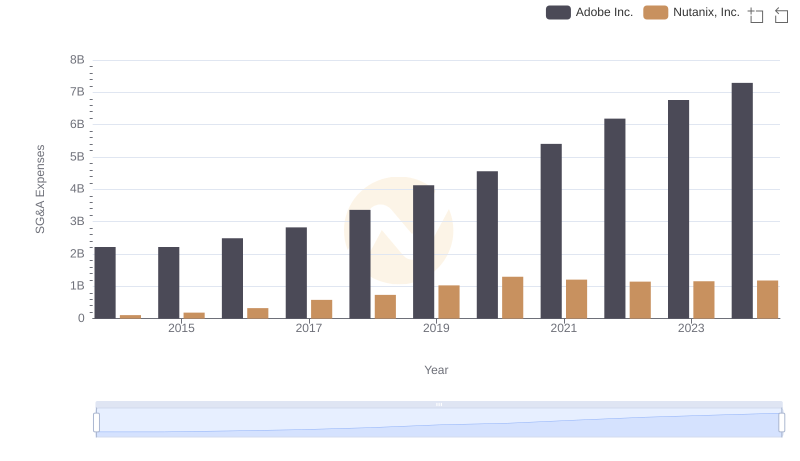
Cost Management Insights: SG&A Expenses for Adobe Inc. and Nutanix, Inc.