| __timestamp | Eaton Corporation plc | Stanley Black & Decker, Inc. |
|---|---|---|
| Wednesday, January 1, 2014 | 6906000000 | 4102700000 |
| Thursday, January 1, 2015 | 6563000000 | 4072000000 |
| Friday, January 1, 2016 | 6347000000 | 4267200000 |
| Sunday, January 1, 2017 | 6648000000 | 4778000000 |
| Monday, January 1, 2018 | 7098000000 | 4901900000 |
| Tuesday, January 1, 2019 | 7052000000 | 4805500000 |
| Wednesday, January 1, 2020 | 5450000000 | 4967900000 |
| Friday, January 1, 2021 | 6335000000 | 5194200000 |
| Saturday, January 1, 2022 | 6887000000 | 4284100000 |
| Sunday, January 1, 2023 | 8433000000 | 4098000000 |
| Monday, January 1, 2024 | 9503000000 | 4514400000 |
In pursuit of knowledge
In the ever-evolving landscape of industrial manufacturing, Eaton Corporation plc and Stanley Black & Decker, Inc. have been pivotal players. Over the past decade, Eaton has demonstrated a robust growth trajectory, with its gross profit surging by approximately 22% from 2014 to 2023. In contrast, Stanley Black & Decker experienced a more modest fluctuation, peaking in 2021 before a slight decline by 2023.
Eaton's gross profit saw a significant dip in 2020, likely due to global economic disruptions, but rebounded impressively by 2023, reaching its highest point. Meanwhile, Stanley Black & Decker's profits remained relatively stable, with a notable peak in 2021. This comparison highlights Eaton's resilience and adaptability in a competitive market.
Eaton's strategic initiatives and market adaptability have positioned it as a leader in gross profit growth, outpacing Stanley Black & Decker by a notable margin.
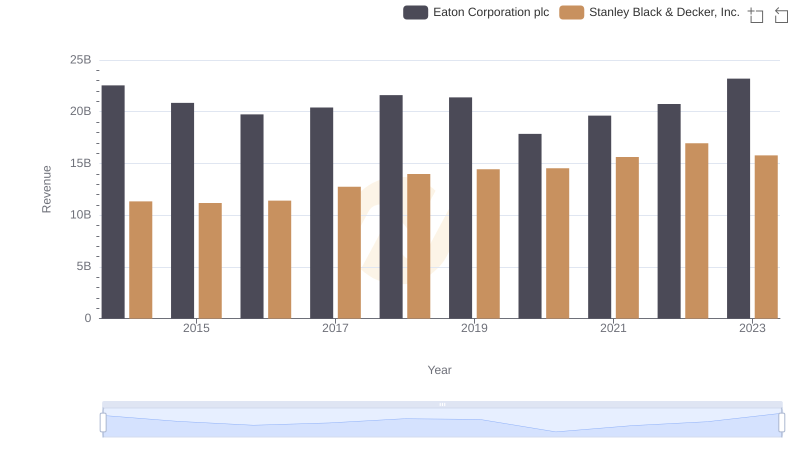
Annual Revenue Comparison: Eaton Corporation plc vs Stanley Black & Decker, Inc.

Comparing Cost of Revenue Efficiency: Eaton Corporation plc vs Stanley Black & Decker, Inc.
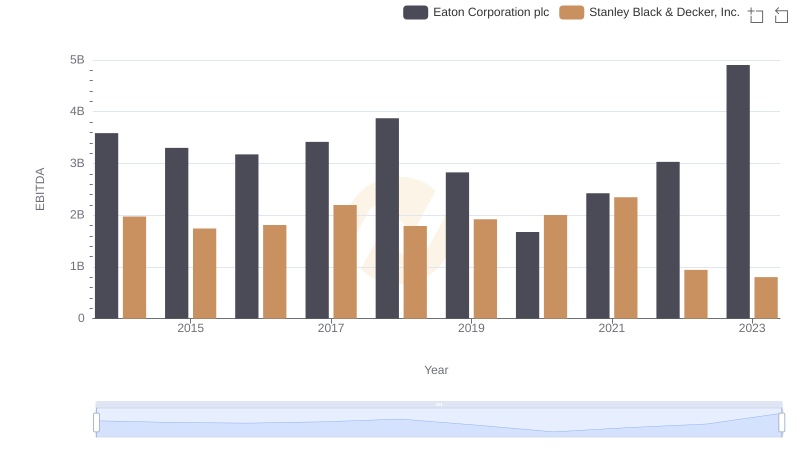
Professional EBITDA Benchmarking: Eaton Corporation plc vs Stanley Black & Decker, Inc.
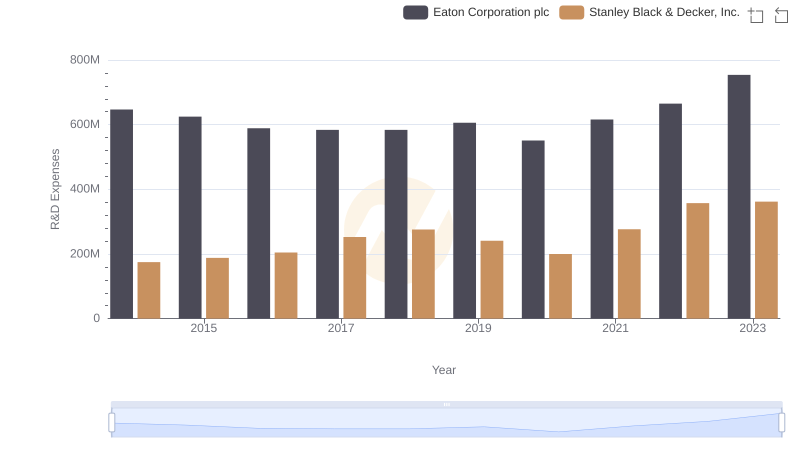
Analyzing R&D Budgets: Eaton Corporation plc vs Stanley Black & Decker, Inc.
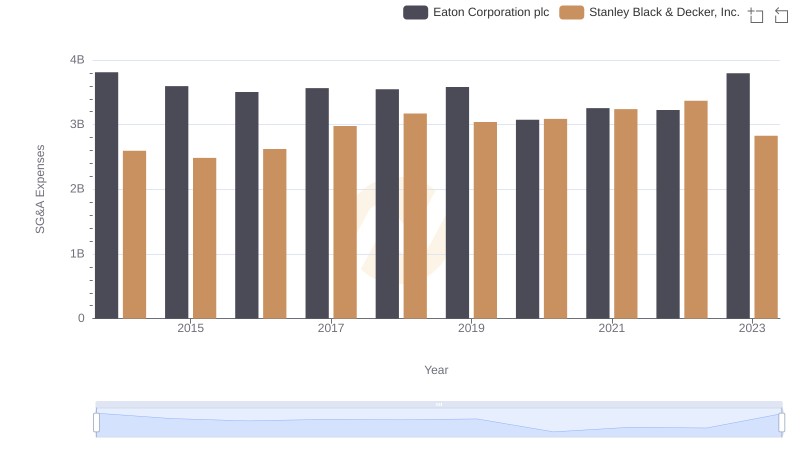
Selling, General, and Administrative Costs: Eaton Corporation plc vs Stanley Black & Decker, Inc.

Eaton Corporation plc and Stanley Black & Decker, Inc.: A Detailed Examination of EBITDA Performance