| __timestamp | Eaton Corporation plc | Stanley Black & Decker, Inc. |
|---|---|---|
| Wednesday, January 1, 2014 | 22552000000 | 11338600000 |
| Thursday, January 1, 2015 | 20855000000 | 11171800000 |
| Friday, January 1, 2016 | 19747000000 | 11406900000 |
| Sunday, January 1, 2017 | 20404000000 | 12747200000 |
| Monday, January 1, 2018 | 21609000000 | 13982400000 |
| Tuesday, January 1, 2019 | 21390000000 | 14442200000 |
| Wednesday, January 1, 2020 | 17858000000 | 14534600000 |
| Friday, January 1, 2021 | 19628000000 | 15617200000 |
| Saturday, January 1, 2022 | 20752000000 | 16947400000 |
| Sunday, January 1, 2023 | 23196000000 | 15781100000 |
| Monday, January 1, 2024 | 24878000000 | 15365700000 |
Unleashing insights
In the competitive landscape of industrial manufacturing, Eaton Corporation plc and Stanley Black & Decker, Inc. have been formidable players. Over the past decade, Eaton has consistently outperformed Stanley Black & Decker in terms of revenue. From 2014 to 2023, Eaton's revenue grew by approximately 3%, peaking in 2023 with a 12% increase from its 2020 low. In contrast, Stanley Black & Decker saw a more modest growth of around 40% over the same period, with its highest revenue recorded in 2022. This comparison highlights Eaton's resilience and strategic positioning, especially during economic downturns like 2020, where it experienced a dip but quickly rebounded. As the industrial sector continues to evolve, these companies' ability to adapt and innovate will be crucial in maintaining their market positions.

Comparing Cost of Revenue Efficiency: Eaton Corporation plc vs Stanley Black & Decker, Inc.
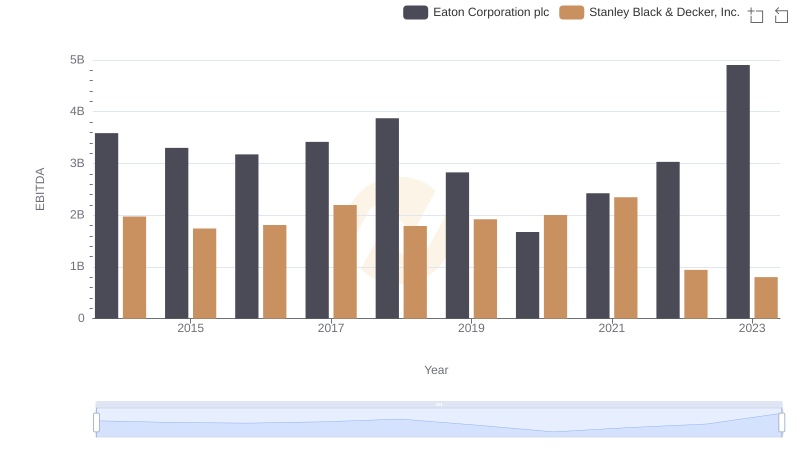
Professional EBITDA Benchmarking: Eaton Corporation plc vs Stanley Black & Decker, Inc.
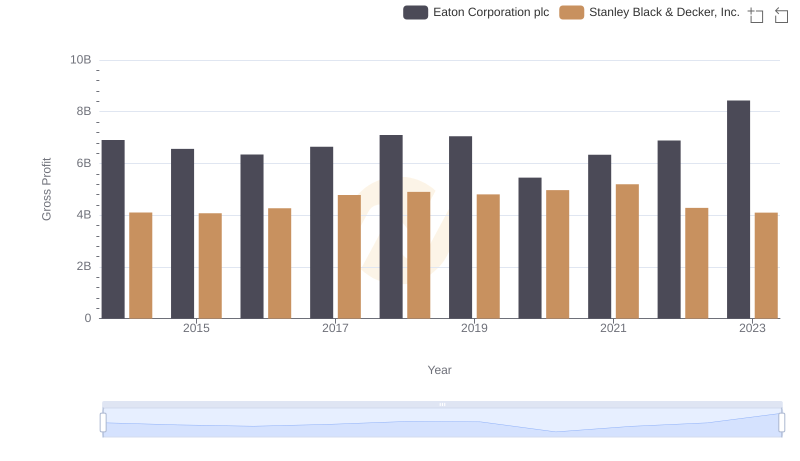
Gross Profit Trends Compared: Eaton Corporation plc vs Stanley Black & Decker, Inc.
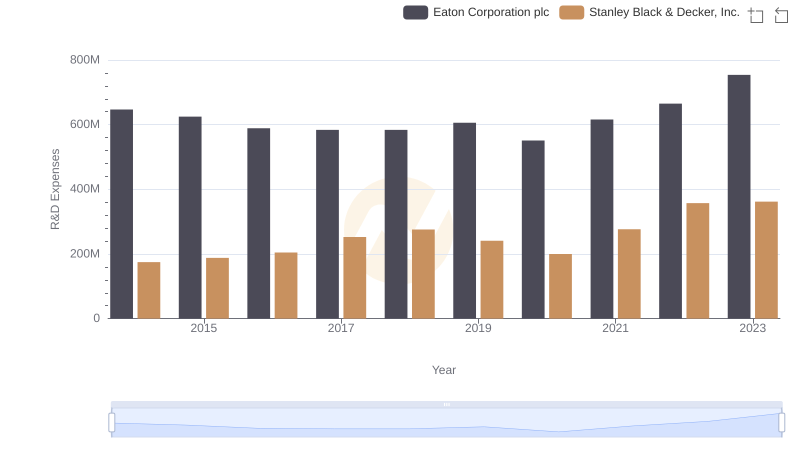
Analyzing R&D Budgets: Eaton Corporation plc vs Stanley Black & Decker, Inc.
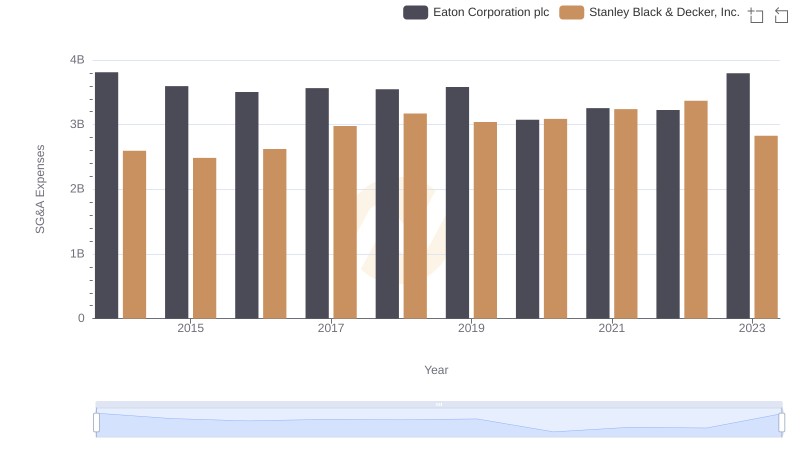
Selling, General, and Administrative Costs: Eaton Corporation plc vs Stanley Black & Decker, Inc.

Eaton Corporation plc and Stanley Black & Decker, Inc.: A Detailed Examination of EBITDA Performance