| __timestamp | Eaton Corporation plc | Stanley Black & Decker, Inc. |
|---|---|---|
| Wednesday, January 1, 2014 | 3810000000 | 2595900000 |
| Thursday, January 1, 2015 | 3596000000 | 2486400000 |
| Friday, January 1, 2016 | 3505000000 | 2623900000 |
| Sunday, January 1, 2017 | 3565000000 | 2980100000 |
| Monday, January 1, 2018 | 3548000000 | 3171700000 |
| Tuesday, January 1, 2019 | 3583000000 | 3041000000 |
| Wednesday, January 1, 2020 | 3075000000 | 3089600000 |
| Friday, January 1, 2021 | 3256000000 | 3240400000 |
| Saturday, January 1, 2022 | 3227000000 | 3370000000 |
| Sunday, January 1, 2023 | 3795000000 | 2829300000 |
| Monday, January 1, 2024 | 4077000000 | 3310500000 |
Unleashing insights
In the ever-evolving landscape of industrial giants, Eaton Corporation plc and Stanley Black & Decker, Inc. have showcased intriguing trends in their Selling, General, and Administrative (SG&A) expenses over the past decade. From 2014 to 2023, Eaton's SG&A costs have seen a modest decline of approximately 4%, while Stanley Black & Decker experienced a more volatile journey, with a peak in 2022, marking a 35% increase from 2014, before a notable drop in 2023.
This fluctuation reflects broader industry dynamics and strategic shifts within these companies. Eaton's consistent cost management contrasts with Stanley Black & Decker's adaptive strategies in response to market demands. As we delve into these financial narratives, the data underscores the importance of strategic agility and cost efficiency in maintaining competitive advantage in the industrial sector.
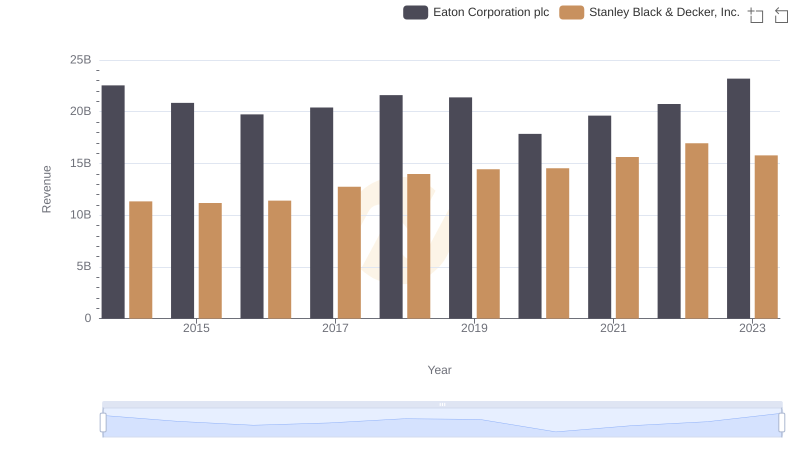
Annual Revenue Comparison: Eaton Corporation plc vs Stanley Black & Decker, Inc.

Comparing Cost of Revenue Efficiency: Eaton Corporation plc vs Stanley Black & Decker, Inc.
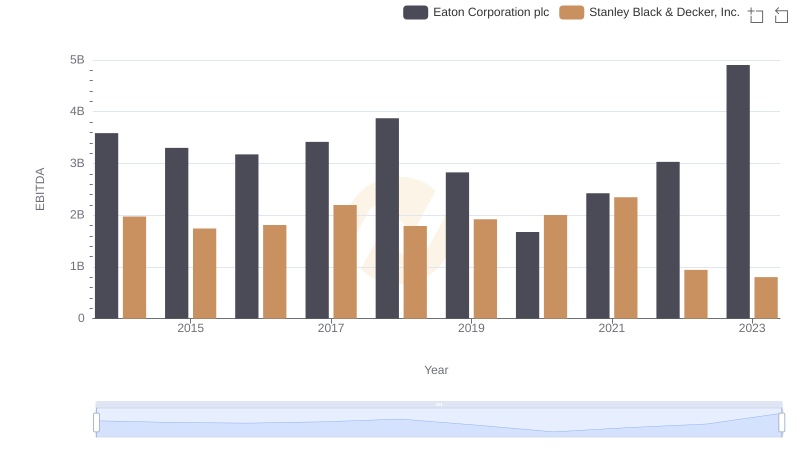
Professional EBITDA Benchmarking: Eaton Corporation plc vs Stanley Black & Decker, Inc.
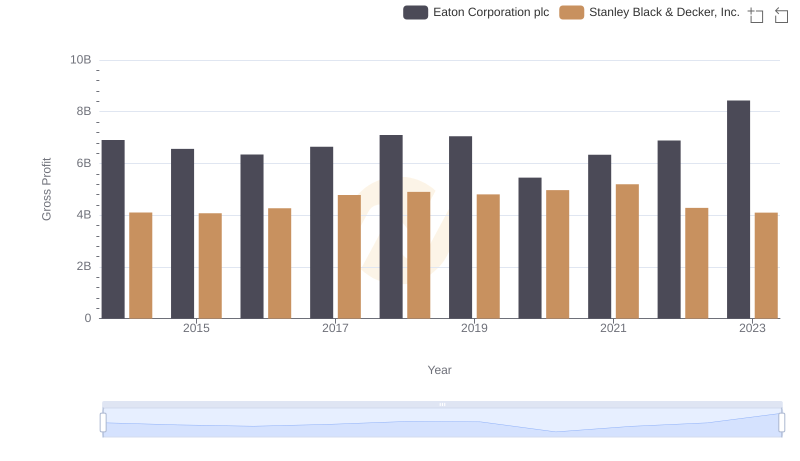
Gross Profit Trends Compared: Eaton Corporation plc vs Stanley Black & Decker, Inc.
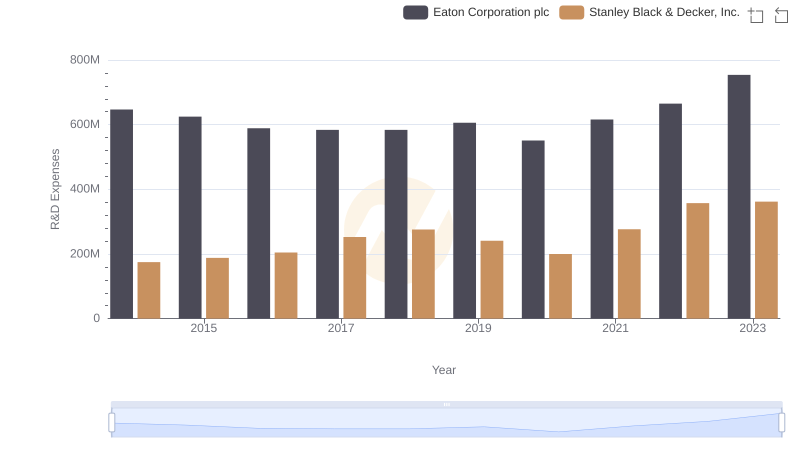
Analyzing R&D Budgets: Eaton Corporation plc vs Stanley Black & Decker, Inc.

Eaton Corporation plc and Stanley Black & Decker, Inc.: A Detailed Examination of EBITDA Performance