| __timestamp | Eaton Corporation plc | Stanley Black & Decker, Inc. |
|---|---|---|
| Wednesday, January 1, 2014 | 3586000000 | 1975400000 |
| Thursday, January 1, 2015 | 3302000000 | 1741900000 |
| Friday, January 1, 2016 | 3176000000 | 1810200000 |
| Sunday, January 1, 2017 | 3418000000 | 2196000000 |
| Monday, January 1, 2018 | 3875000000 | 1791200000 |
| Tuesday, January 1, 2019 | 2827000000 | 1920600000 |
| Wednesday, January 1, 2020 | 1674000000 | 2004200000 |
| Friday, January 1, 2021 | 2423000000 | 2345500000 |
| Saturday, January 1, 2022 | 3031000000 | 942800000 |
| Sunday, January 1, 2023 | 4904000000 | 802700000 |
| Monday, January 1, 2024 | 5547999771 | 286300000 |
Infusing magic into the data realm
In the ever-evolving landscape of industrial manufacturing, understanding the financial health of key players is crucial. This analysis delves into the EBITDA performance of Eaton Corporation plc and Stanley Black & Decker, Inc. from 2014 to 2023. Over this period, Eaton demonstrated a robust growth trajectory, with its EBITDA peaking at approximately 4.9 billion in 2023, marking a 37% increase from its 2014 figures. In contrast, Stanley Black & Decker experienced a more volatile journey, with its EBITDA reaching a high of around 2.3 billion in 2021 before declining sharply to 802 million in 2023, a 59% drop. This divergence highlights Eaton's strategic resilience and adaptability in a competitive market, while Stanley Black & Decker faces challenges in maintaining consistent growth. As the industrial sector continues to adapt to global changes, these insights provide a window into the financial strategies of two industry giants.
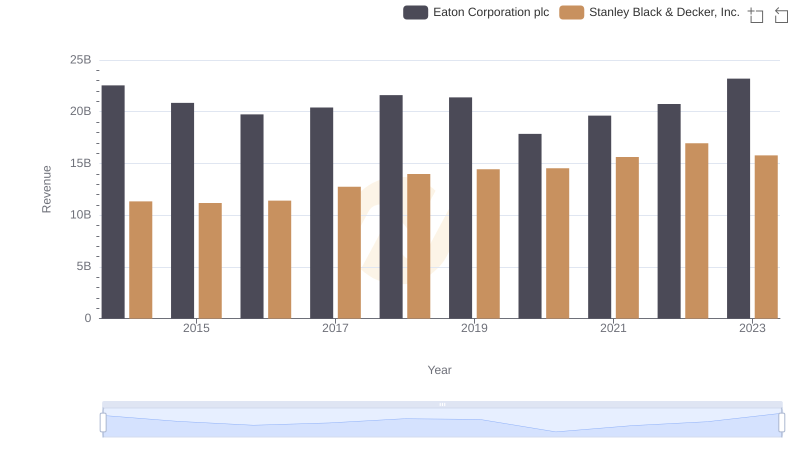
Annual Revenue Comparison: Eaton Corporation plc vs Stanley Black & Decker, Inc.

Comparing Cost of Revenue Efficiency: Eaton Corporation plc vs Stanley Black & Decker, Inc.
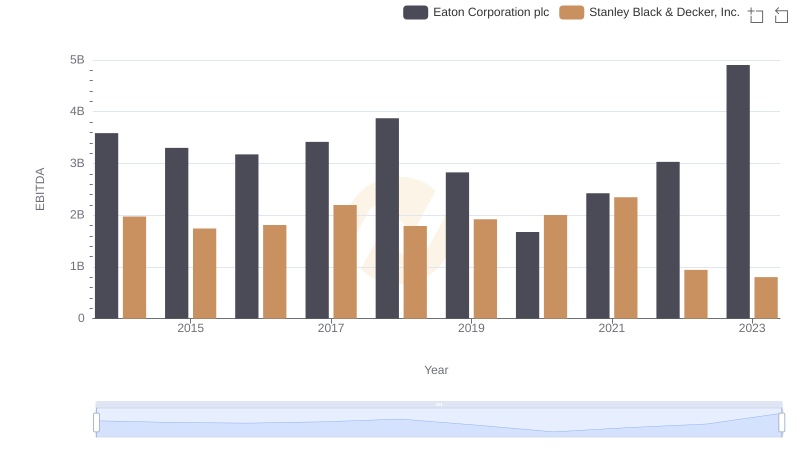
Professional EBITDA Benchmarking: Eaton Corporation plc vs Stanley Black & Decker, Inc.
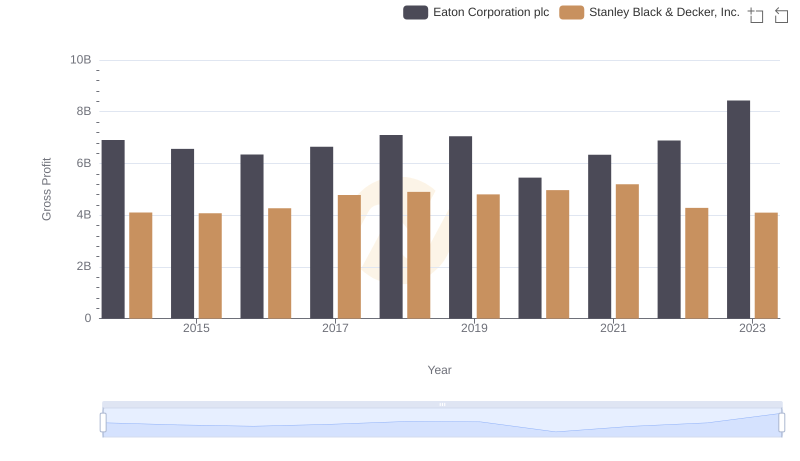
Gross Profit Trends Compared: Eaton Corporation plc vs Stanley Black & Decker, Inc.
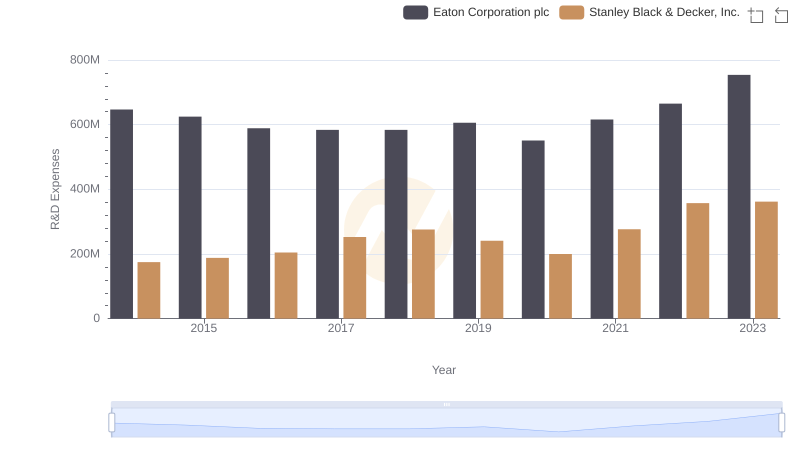
Analyzing R&D Budgets: Eaton Corporation plc vs Stanley Black & Decker, Inc.
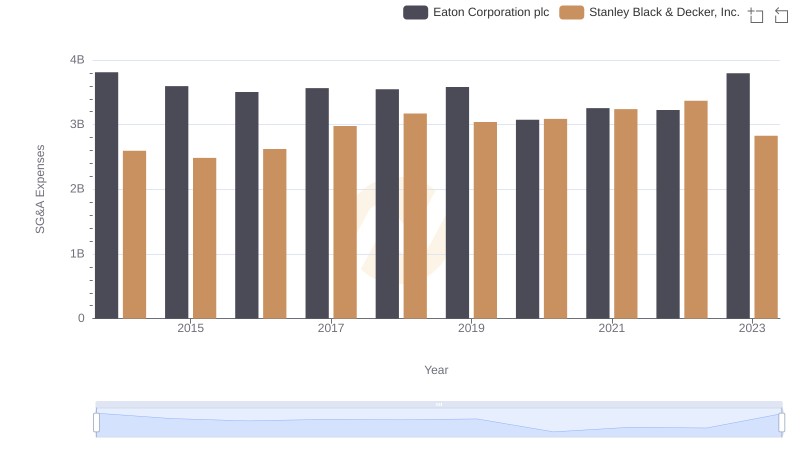
Selling, General, and Administrative Costs: Eaton Corporation plc vs Stanley Black & Decker, Inc.