| __timestamp | AMETEK, Inc. | Southwest Airlines Co. |
|---|---|---|
| Wednesday, January 1, 2014 | 2597017000 | 14049000000 |
| Thursday, January 1, 2015 | 2549280000 | 13423000000 |
| Friday, January 1, 2016 | 2575220000 | 14151000000 |
| Sunday, January 1, 2017 | 2851431000 | 14968000000 |
| Monday, January 1, 2018 | 3186310000 | 15907000000 |
| Tuesday, January 1, 2019 | 3370897000 | 16445000000 |
| Wednesday, January 1, 2020 | 2996515000 | 10938000000 |
| Friday, January 1, 2021 | 3633900000 | 11675000000 |
| Saturday, January 1, 2022 | 4005261000 | 19062000000 |
| Sunday, January 1, 2023 | 4212484999 | 21868000000 |
| Monday, January 1, 2024 | 0 | 23024000000 |
Unveiling the hidden dimensions of data
In the ever-evolving landscape of corporate expenses, AMETEK, Inc. and Southwest Airlines Co. offer a fascinating study in contrasts. Over the past decade, AMETEK, a leader in electronic instruments, has seen its cost of revenue grow by approximately 62%, from $2.6 billion in 2014 to $4.2 billion in 2023. This steady increase reflects the company's strategic investments in innovation and expansion.
Meanwhile, Southwest Airlines, a titan in the aviation industry, experienced a more volatile journey. The airline's cost of revenue peaked at $21.9 billion in 2023, marking a 56% increase from its 2014 figures. However, the pandemic-induced dip in 2020, when costs plummeted to $10.9 billion, underscores the industry's vulnerability to global disruptions.
These insights reveal not just the financial trajectories of two major companies, but also the broader economic forces shaping their respective sectors.
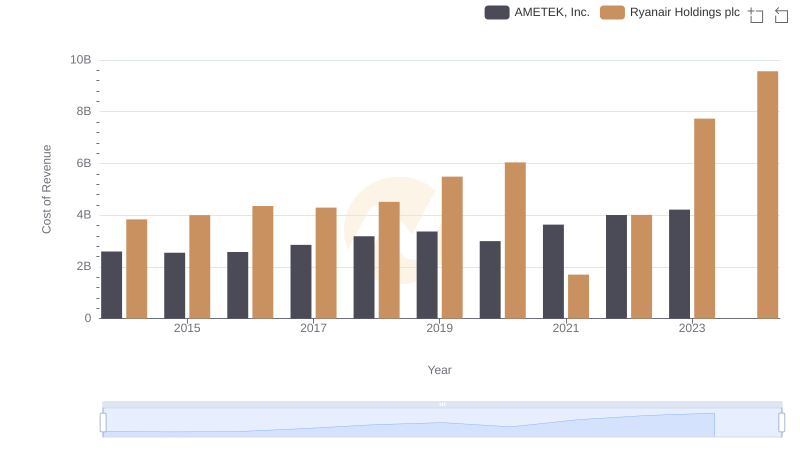
AMETEK, Inc. vs Ryanair Holdings plc: Efficiency in Cost of Revenue Explored
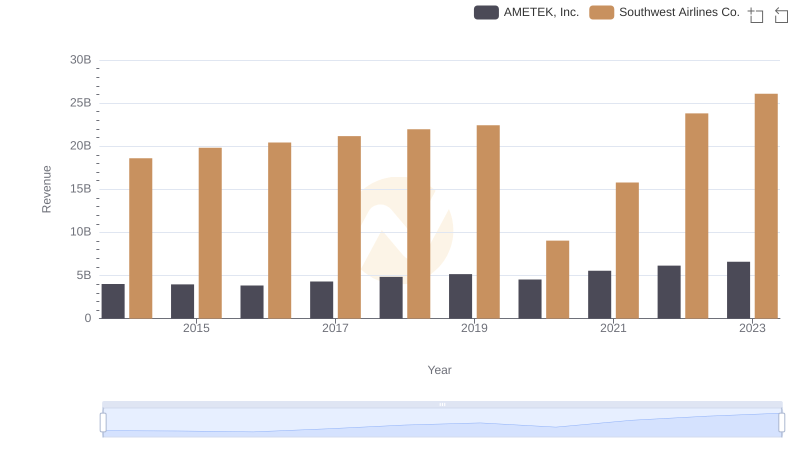
Who Generates More Revenue? AMETEK, Inc. or Southwest Airlines Co.

Cost Insights: Breaking Down AMETEK, Inc. and Hubbell Incorporated's Expenses
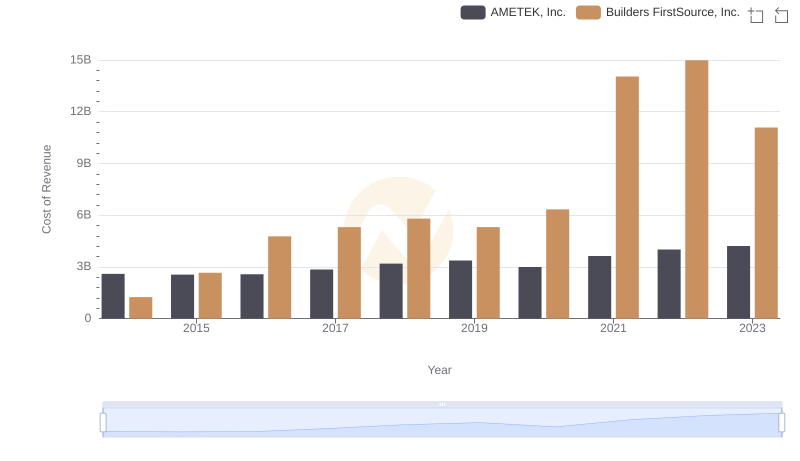
Cost of Revenue Comparison: AMETEK, Inc. vs Builders FirstSource, Inc.
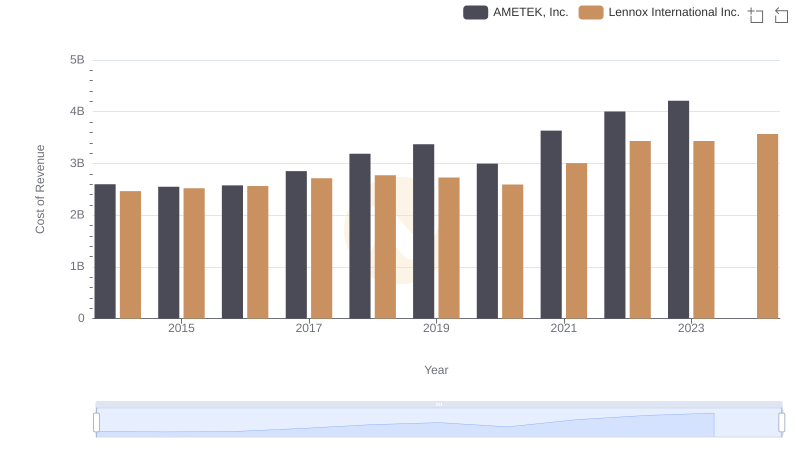
Cost of Revenue Comparison: AMETEK, Inc. vs Lennox International Inc.
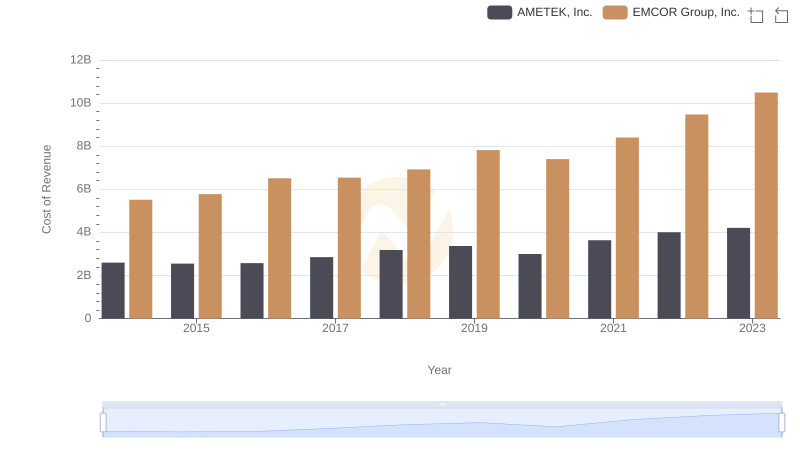
Cost of Revenue Trends: AMETEK, Inc. vs EMCOR Group, Inc.
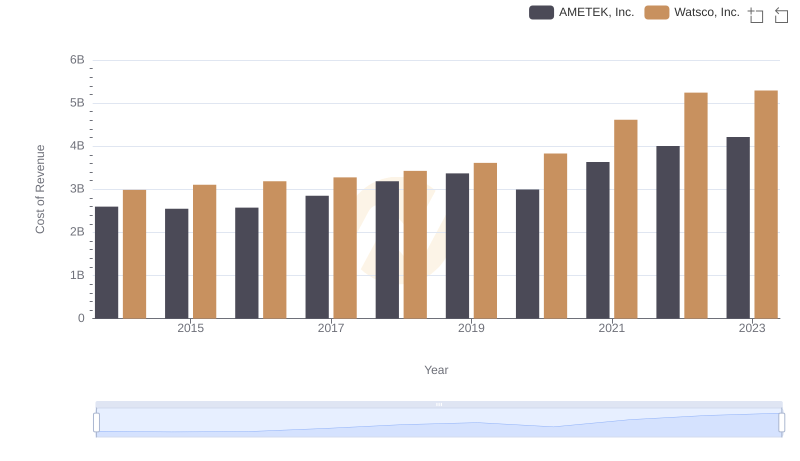
Comparing Cost of Revenue Efficiency: AMETEK, Inc. vs Watsco, Inc.
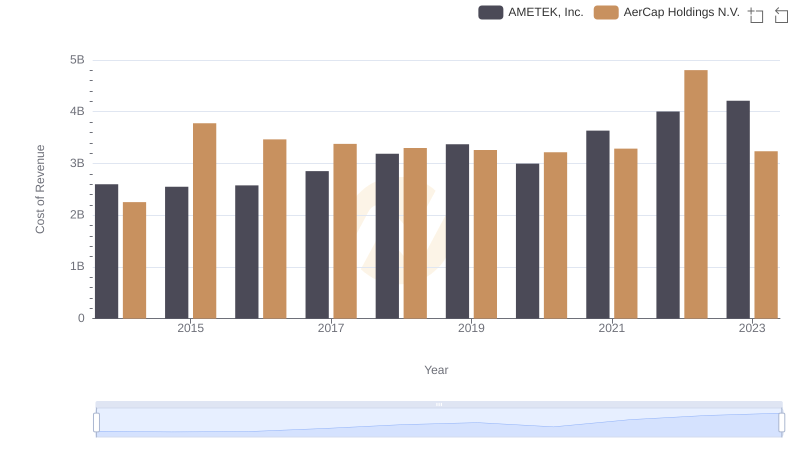
Cost of Revenue: Key Insights for AMETEK, Inc. and AerCap Holdings N.V.
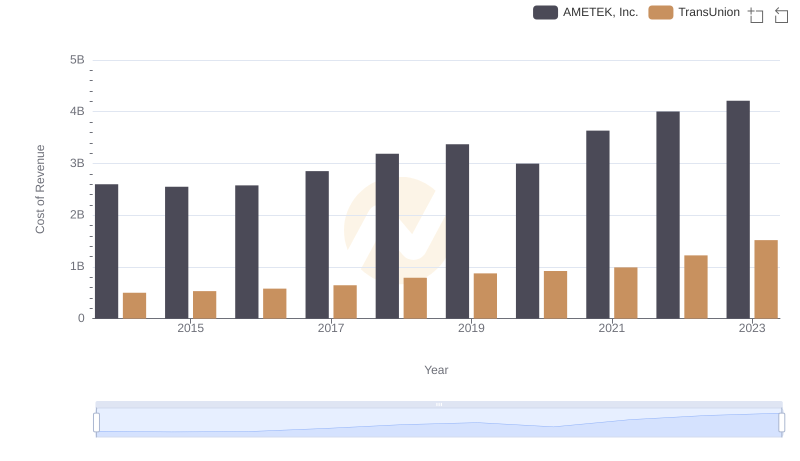
Cost of Revenue: Key Insights for AMETEK, Inc. and TransUnion
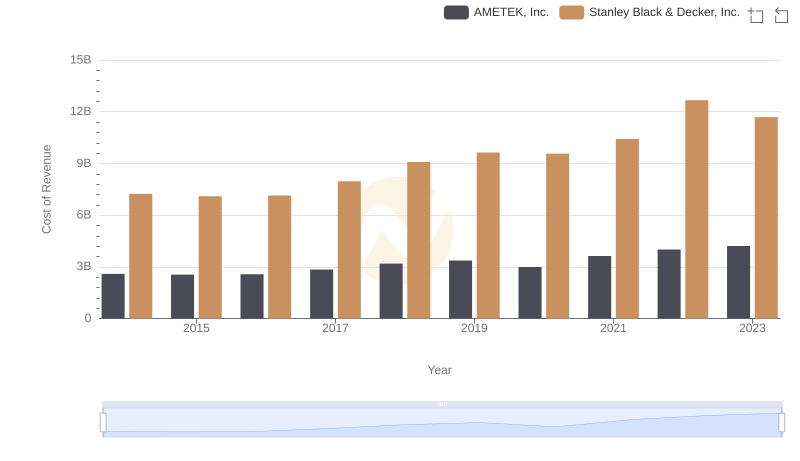
Comparing Cost of Revenue Efficiency: AMETEK, Inc. vs Stanley Black & Decker, Inc.
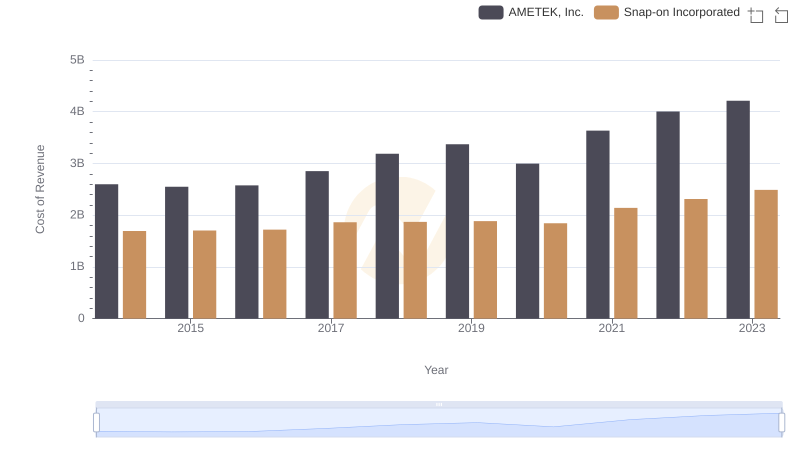
Cost of Revenue Trends: AMETEK, Inc. vs Snap-on Incorporated