| __timestamp | Cintas Corporation | TFI International Inc. |
|---|---|---|
| Wednesday, January 1, 2014 | 793811000 | 334908602 |
| Thursday, January 1, 2015 | 877761000 | 314924803 |
| Friday, January 1, 2016 | 933728000 | 325584405 |
| Sunday, January 1, 2017 | 968293000 | 517899005 |
| Monday, January 1, 2018 | 1227852000 | 521265317 |
| Tuesday, January 1, 2019 | 1564228000 | 674440000 |
| Wednesday, January 1, 2020 | 1542737000 | 709296000 |
| Friday, January 1, 2021 | 1773591000 | 1358717000 |
| Saturday, January 1, 2022 | 1990046000 | 1561728000 |
| Sunday, January 1, 2023 | 2221676000 | 1194213000 |
| Monday, January 1, 2024 | 2523857000 |
Infusing magic into the data realm
In the competitive landscape of corporate finance, EBITDA serves as a crucial metric for evaluating a company's operational performance. Over the past decade, Cintas Corporation has demonstrated a robust growth trajectory, with its EBITDA increasing by approximately 218% from 2014 to 2023. This impressive growth reflects Cintas' strategic initiatives and operational efficiencies. In contrast, TFI International Inc. has also shown significant progress, with its EBITDA rising by nearly 270% from 2014 to 2022, before a notable dip in 2023. This fluctuation highlights the dynamic nature of the logistics and transportation industry, where TFI operates. The data reveals a compelling narrative of resilience and adaptation, with both companies navigating economic challenges and capitalizing on market opportunities. As we look to the future, these trends underscore the importance of strategic agility in sustaining financial growth.
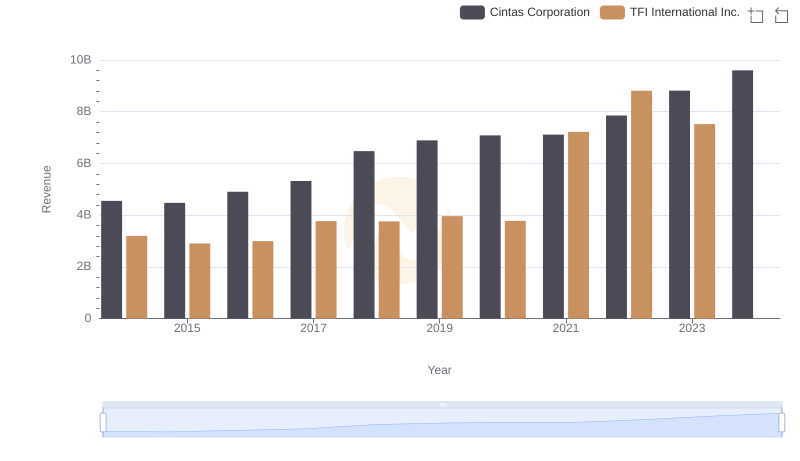
Cintas Corporation vs TFI International Inc.: Annual Revenue Growth Compared
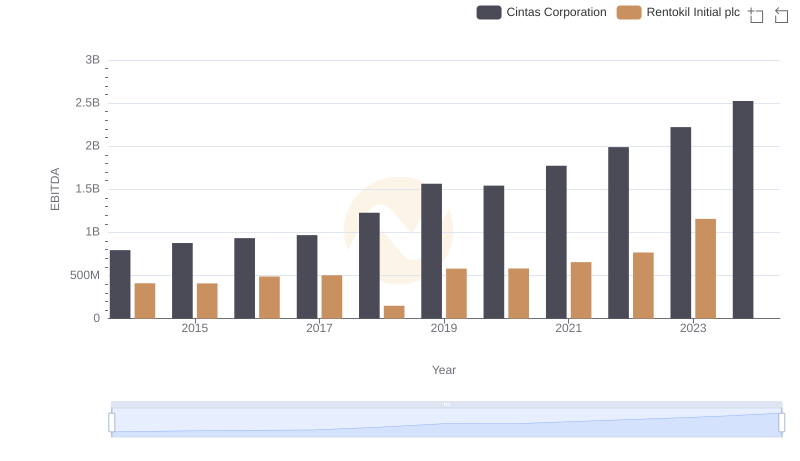
Comparative EBITDA Analysis: Cintas Corporation vs Rentokil Initial plc
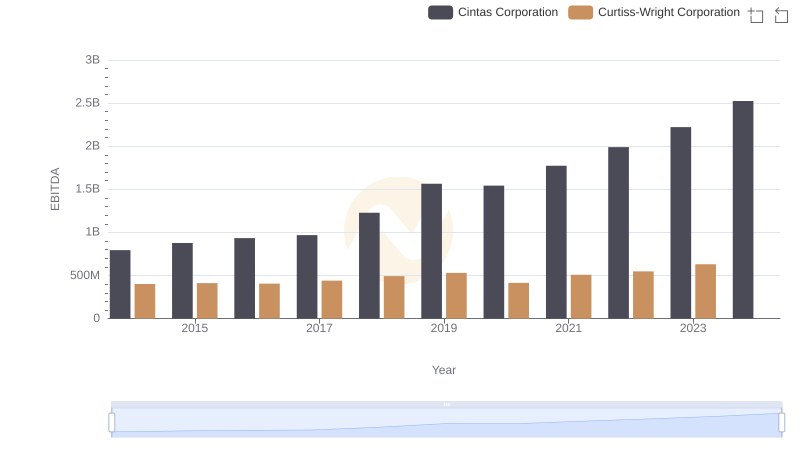
Comprehensive EBITDA Comparison: Cintas Corporation vs Curtiss-Wright Corporation
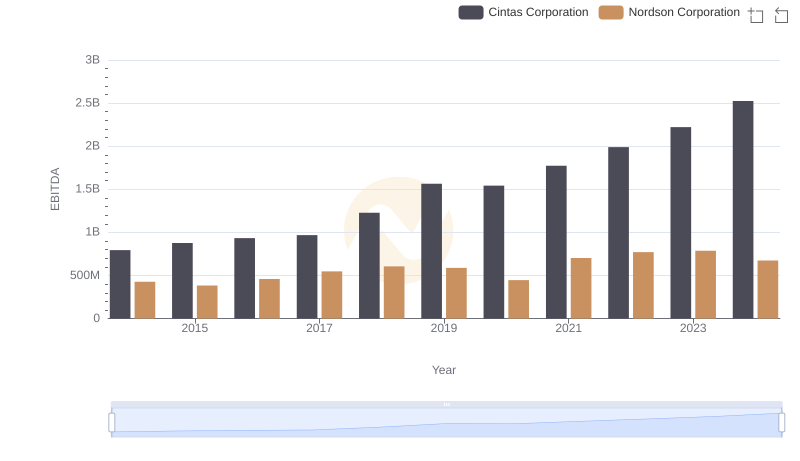
Comparative EBITDA Analysis: Cintas Corporation vs Nordson Corporation
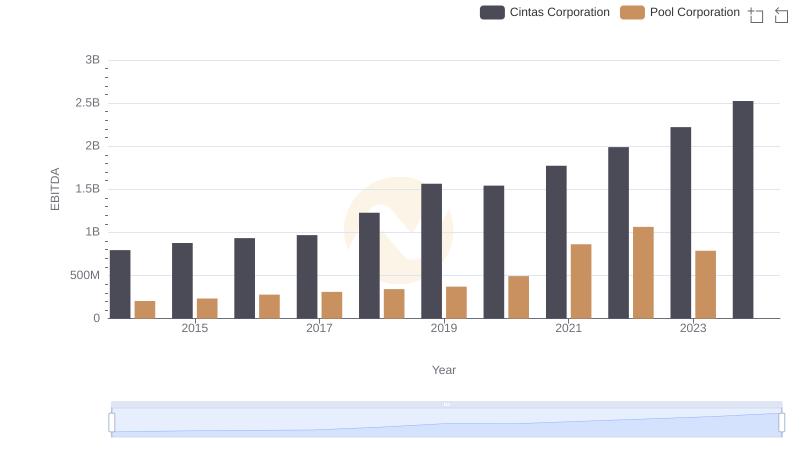
Comparative EBITDA Analysis: Cintas Corporation vs Pool Corporation