| __timestamp | Watsco, Inc. | XPO Logistics, Inc. |
|---|---|---|
| Wednesday, January 1, 2014 | 2988138000 | 1975000000 |
| Thursday, January 1, 2015 | 3105882000 | 6538400000 |
| Friday, January 1, 2016 | 3186118000 | 12480100000 |
| Sunday, January 1, 2017 | 3276296000 | 13101100000 |
| Monday, January 1, 2018 | 3426401000 | 14738000000 |
| Tuesday, January 1, 2019 | 3613406000 | 13982000000 |
| Wednesday, January 1, 2020 | 3832107000 | 13689000000 |
| Friday, January 1, 2021 | 4612647000 | 10812000000 |
| Saturday, January 1, 2022 | 5244055000 | 6491000000 |
| Sunday, January 1, 2023 | 5291627000 | 6974000000 |
| Monday, January 1, 2024 | 5573604000 | 7157000000 |
In pursuit of knowledge
In the ever-evolving landscape of American business, cost efficiency remains a pivotal factor for success. Over the past decade, Watsco, Inc. and XPO Logistics, Inc. have demonstrated contrasting trajectories in managing their cost of revenue. From 2014 to 2023, Watsco, Inc. has seen a steady increase in cost efficiency, with a notable 77% rise in their cost of revenue, peaking at approximately $5.3 billion in 2023. Meanwhile, XPO Logistics, Inc. experienced a more volatile journey, with their cost of revenue surging by 253% from 2014 to 2018, before stabilizing around $7 billion in 2023. This comparison highlights the diverse strategies employed by these industry giants in navigating economic challenges and optimizing operational costs. As businesses strive for sustainability, understanding these trends offers valuable insights into effective financial management.
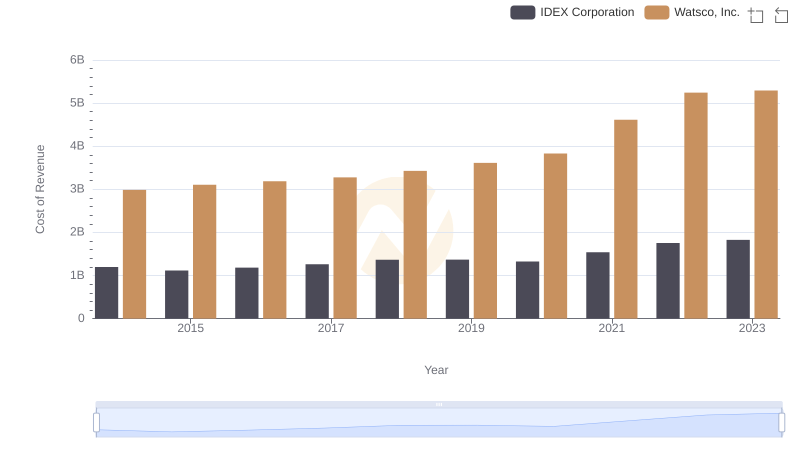
Cost Insights: Breaking Down Watsco, Inc. and IDEX Corporation's Expenses
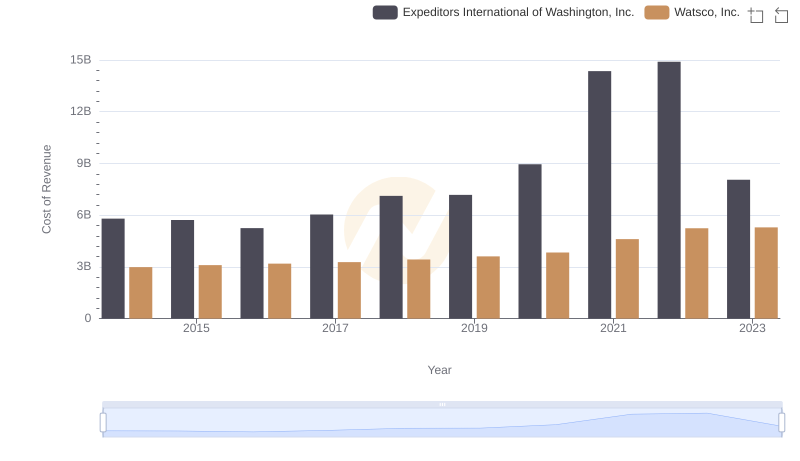
Cost of Revenue: Key Insights for Watsco, Inc. and Expeditors International of Washington, Inc.
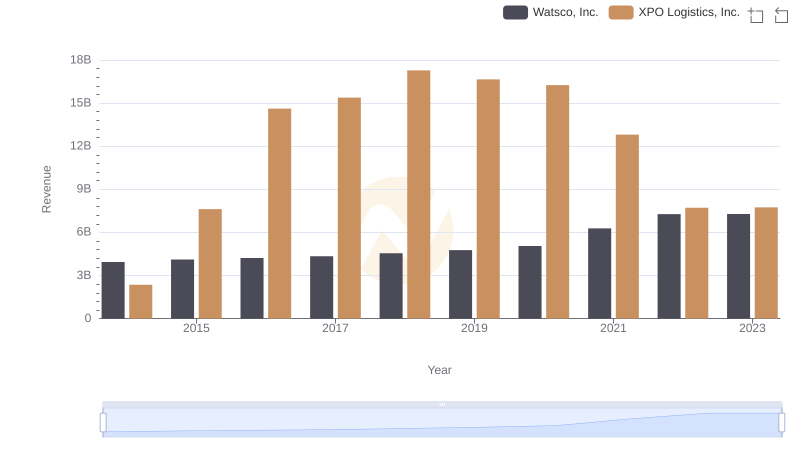
Annual Revenue Comparison: Watsco, Inc. vs XPO Logistics, Inc.
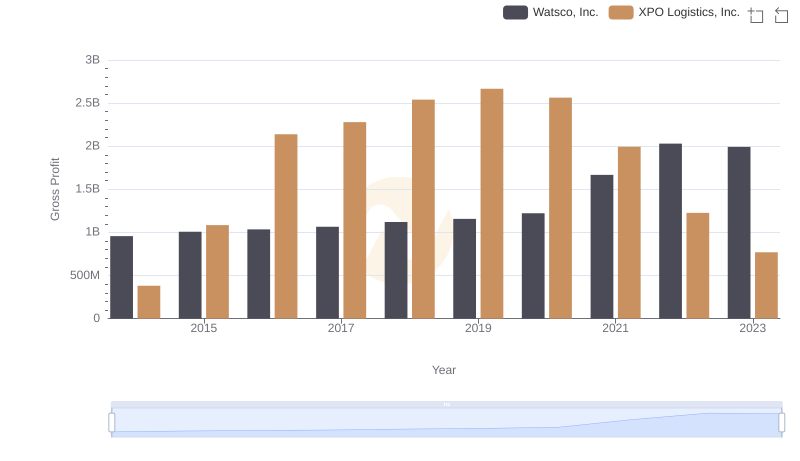
Watsco, Inc. vs XPO Logistics, Inc.: A Gross Profit Performance Breakdown
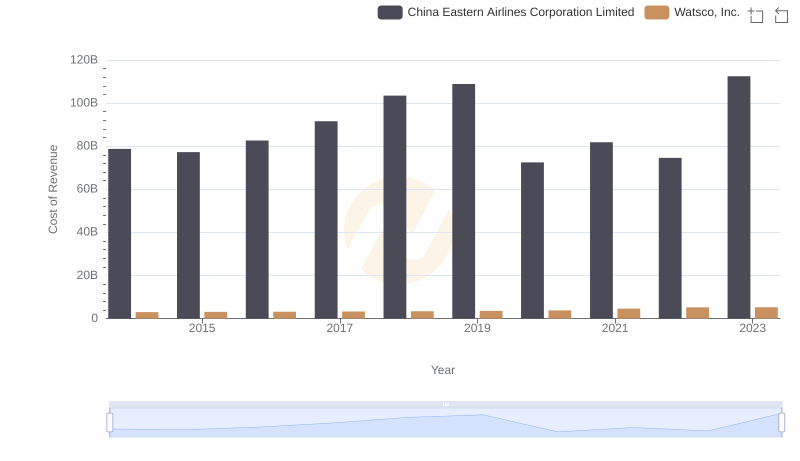
Analyzing Cost of Revenue: Watsco, Inc. and China Eastern Airlines Corporation Limited
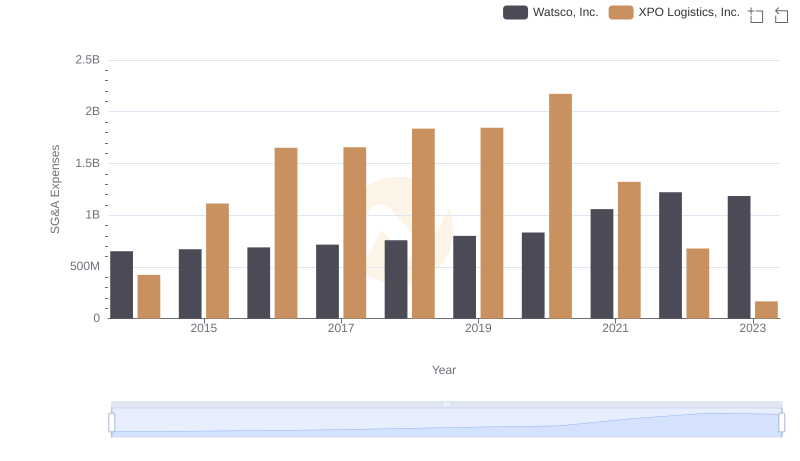
Breaking Down SG&A Expenses: Watsco, Inc. vs XPO Logistics, Inc.
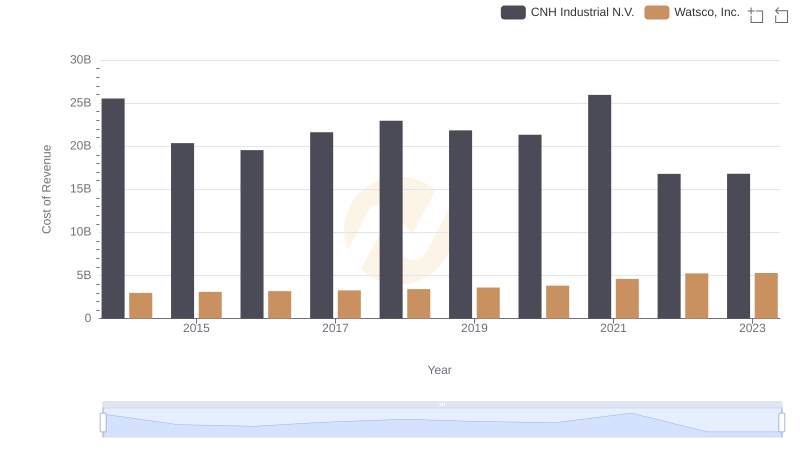
Watsco, Inc. vs CNH Industrial N.V.: Efficiency in Cost of Revenue Explored
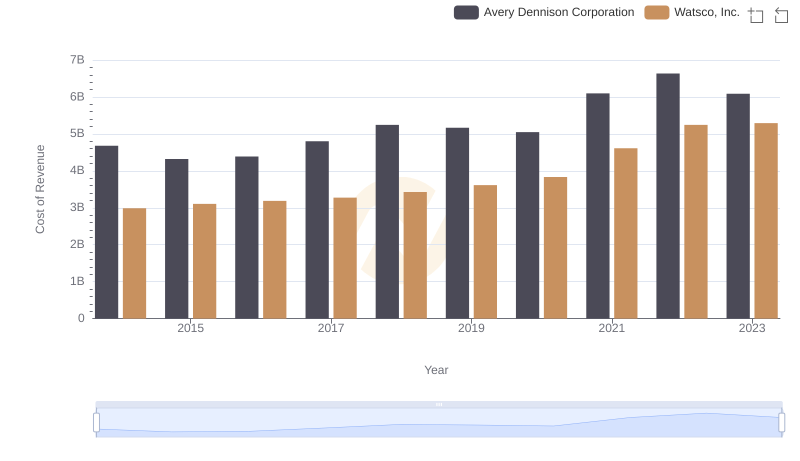
Cost of Revenue Comparison: Watsco, Inc. vs Avery Dennison Corporation
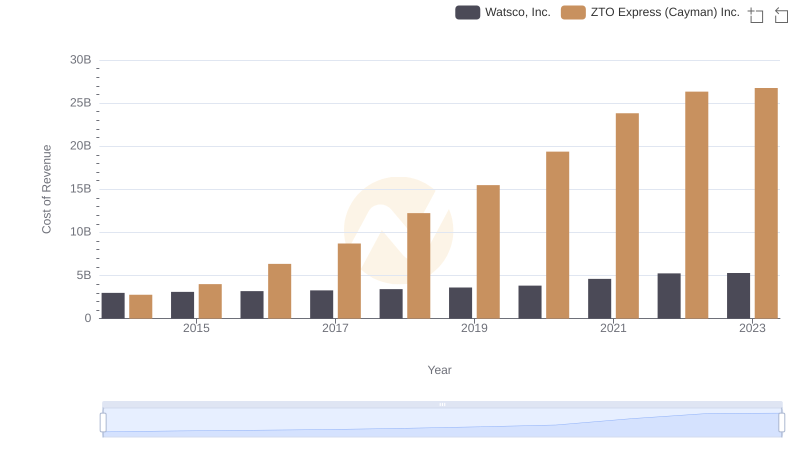
Watsco, Inc. vs ZTO Express (Cayman) Inc.: Efficiency in Cost of Revenue Explored
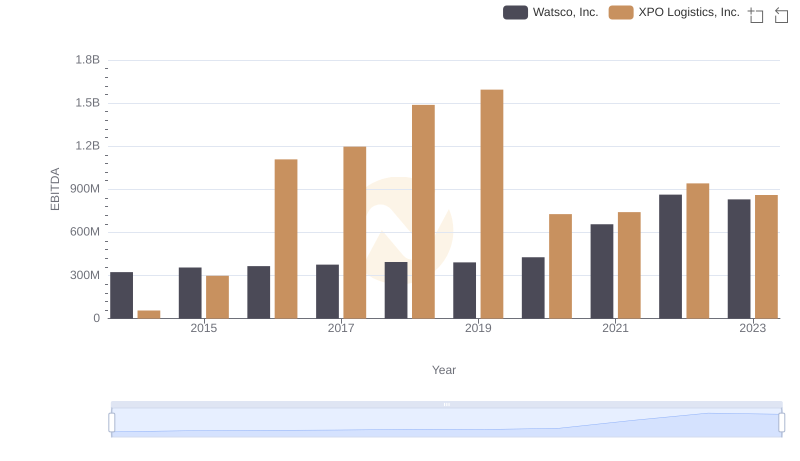
Comparative EBITDA Analysis: Watsco, Inc. vs XPO Logistics, Inc.