| __timestamp | Ingersoll Rand Inc. | TransUnion |
|---|---|---|
| Wednesday, January 1, 2014 | 476000000 | 436000000 |
| Thursday, January 1, 2015 | 427000000 | 499700000 |
| Friday, January 1, 2016 | 414339000 | 560100000 |
| Sunday, January 1, 2017 | 446600000 | 585400000 |
| Monday, January 1, 2018 | 434600000 | 707700000 |
| Tuesday, January 1, 2019 | 436400000 | 812100000 |
| Wednesday, January 1, 2020 | 894800000 | 860300000 |
| Friday, January 1, 2021 | 1028000000 | 943900000 |
| Saturday, January 1, 2022 | 1095800000 | 1337400000 |
| Sunday, January 1, 2023 | 1272700000 | 1171600000 |
| Monday, January 1, 2024 | 0 | 1239300000 |
Cracking the code
In the ever-evolving landscape of corporate finance, Selling, General, and Administrative (SG&A) expenses serve as a critical indicator of a company's operational efficiency. From 2014 to 2023, Ingersoll Rand Inc. and TransUnion have showcased intriguing trends in their SG&A expenses.
Ingersoll Rand Inc. has seen a remarkable increase in SG&A expenses, growing by approximately 167% over the decade. Notably, the year 2020 marked a significant leap, with expenses nearly doubling from the previous year, reflecting strategic investments or restructuring efforts.
TransUnion, on the other hand, experienced a steady rise, with a 169% increase in SG&A expenses by 2022. The peak in 2022 suggests a potential expansion or increased operational costs.
Both companies demonstrate a commitment to growth, albeit through different trajectories. Understanding these trends offers valuable insights into their strategic priorities and market positioning.
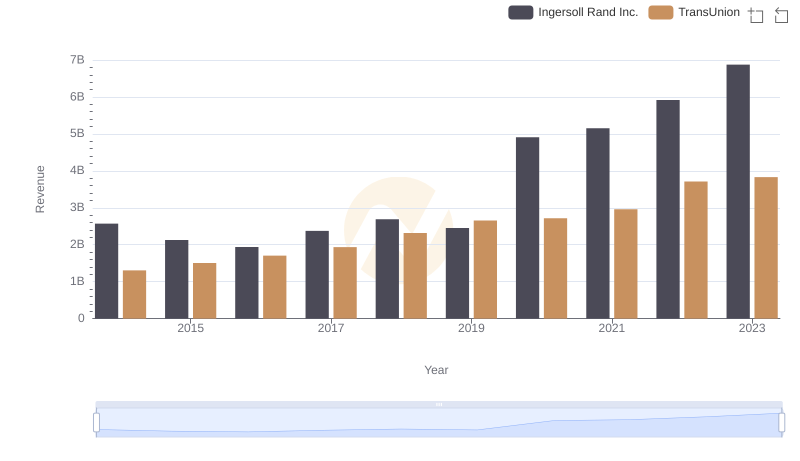
Ingersoll Rand Inc. vs TransUnion: Annual Revenue Growth Compared
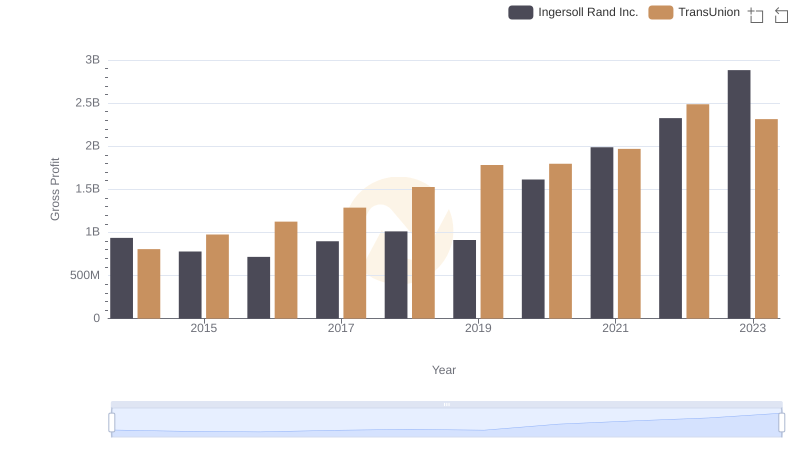
Ingersoll Rand Inc. and TransUnion: A Detailed Gross Profit Analysis
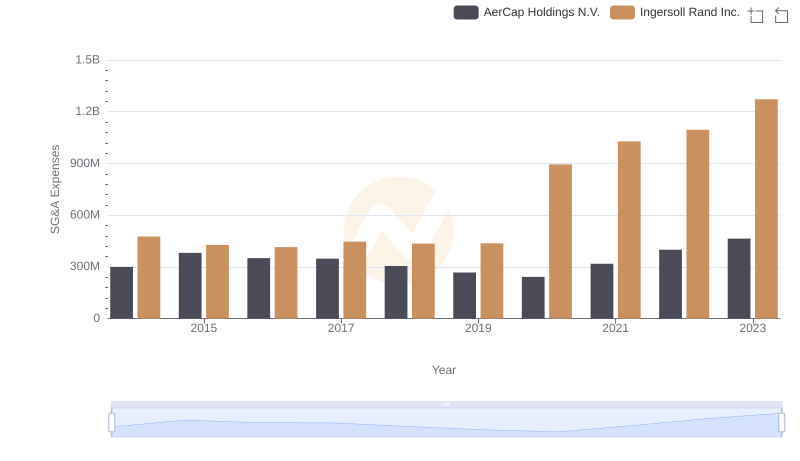
Breaking Down SG&A Expenses: Ingersoll Rand Inc. vs AerCap Holdings N.V.
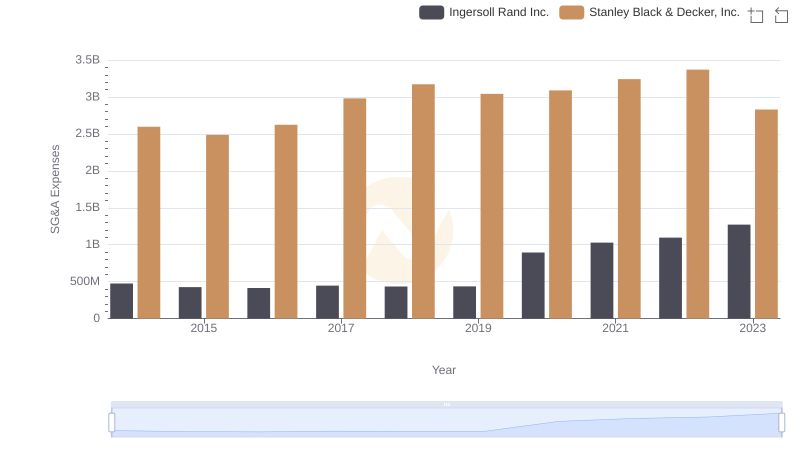
Who Optimizes SG&A Costs Better? Ingersoll Rand Inc. or Stanley Black & Decker, Inc.
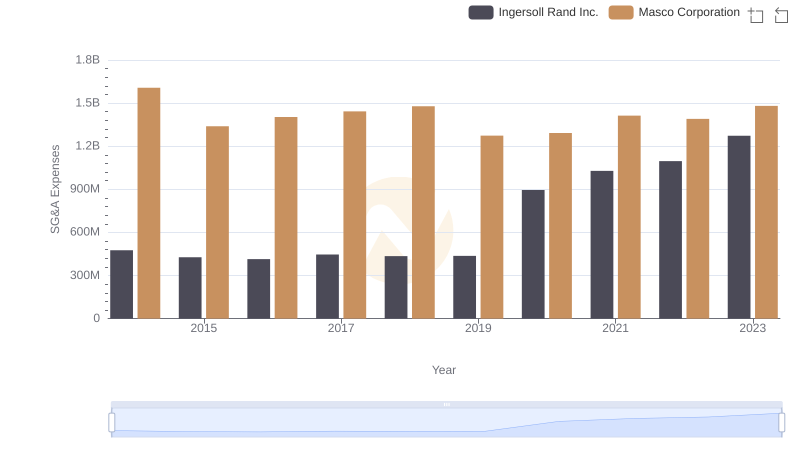
Ingersoll Rand Inc. or Masco Corporation: Who Manages SG&A Costs Better?
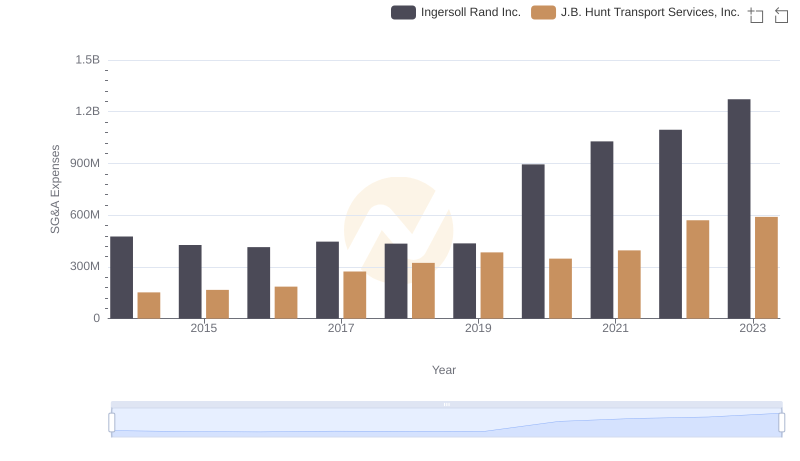
Ingersoll Rand Inc. or J.B. Hunt Transport Services, Inc.: Who Manages SG&A Costs Better?