| __timestamp | Adobe Inc. | Teradyne, Inc. |
|---|---|---|
| Wednesday, January 1, 2014 | 2215140000 | 319713000 |
| Thursday, January 1, 2015 | 2215161000 | 306313000 |
| Friday, January 1, 2016 | 2487907000 | 315682000 |
| Sunday, January 1, 2017 | 2822298000 | 348287000 |
| Monday, January 1, 2018 | 3365727000 | 390669000 |
| Tuesday, January 1, 2019 | 4124984000 | 437083000 |
| Wednesday, January 1, 2020 | 4559000000 | 464769000 |
| Friday, January 1, 2021 | 5406000000 | 547559000 |
| Saturday, January 1, 2022 | 6187000000 | 558103000 |
| Sunday, January 1, 2023 | 6764000000 | 571426000 |
| Monday, January 1, 2024 | 7293000000 | 0 |
Igniting the spark of knowledge
In the ever-evolving landscape of technology, understanding the financial health of industry giants is crucial. Adobe Inc. and Teradyne, Inc. have been pivotal players, each with unique strategies reflected in their Selling, General, and Administrative (SG&A) expenses. From 2014 to 2023, Adobe's SG&A expenses surged by over 200%, highlighting its aggressive growth and expansion strategies. In contrast, Teradyne's expenses grew by approximately 80%, indicating a more conservative approach. Adobe's expenses consistently outpaced Teradyne's, with 2023 figures showing Adobe's SG&A expenses were nearly 12 times higher. This disparity underscores Adobe's expansive market reach and investment in innovation. However, the data for 2024 is incomplete, leaving room for speculation on future trends. As these companies continue to navigate the competitive tech landscape, their financial strategies will undoubtedly shape their trajectories.
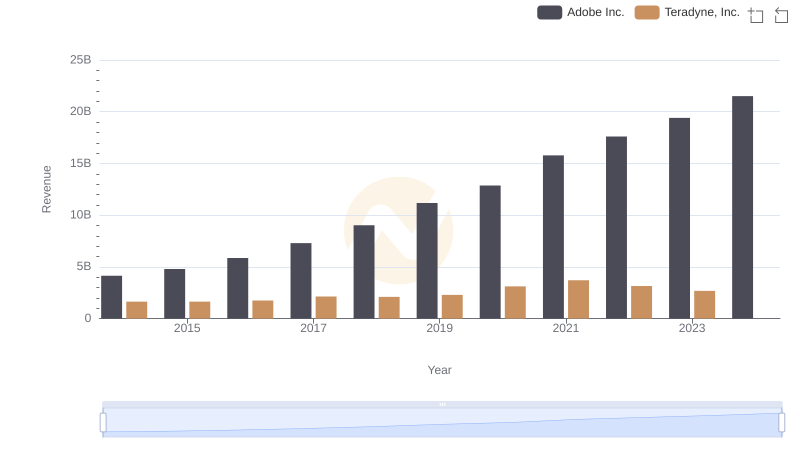
Revenue Insights: Adobe Inc. and Teradyne, Inc. Performance Compared

Adobe Inc. vs Teradyne, Inc.: Efficiency in Cost of Revenue Explored

Gross Profit Comparison: Adobe Inc. and Teradyne, Inc. Trends
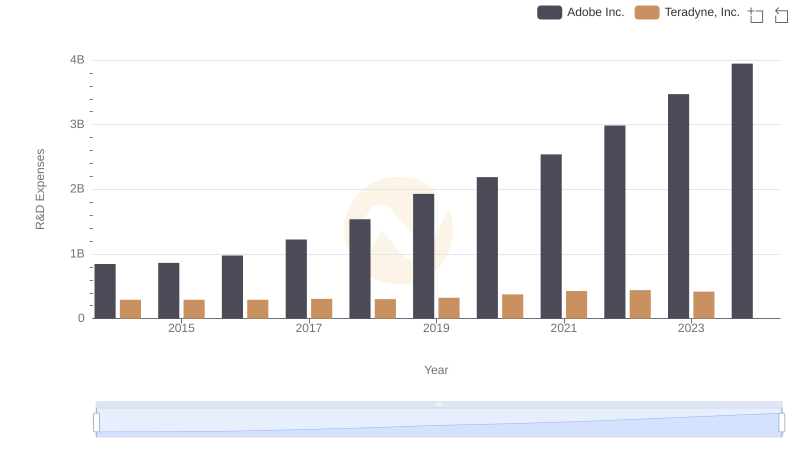
Who Prioritizes Innovation? R&D Spending Compared for Adobe Inc. and Teradyne, Inc.
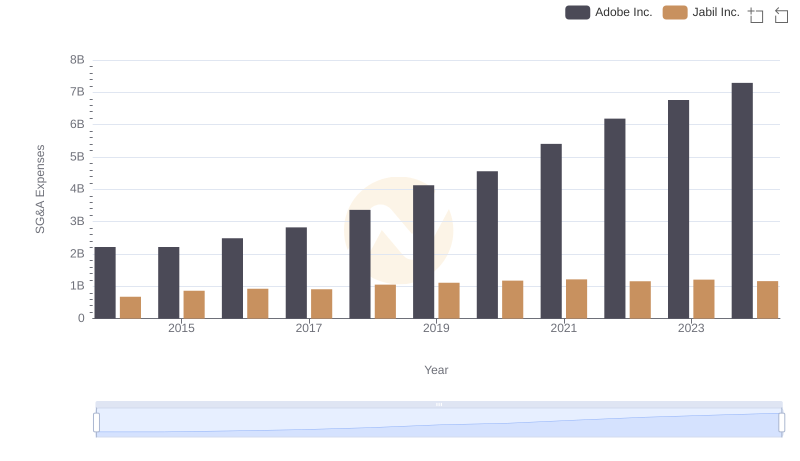
Breaking Down SG&A Expenses: Adobe Inc. vs Jabil Inc.
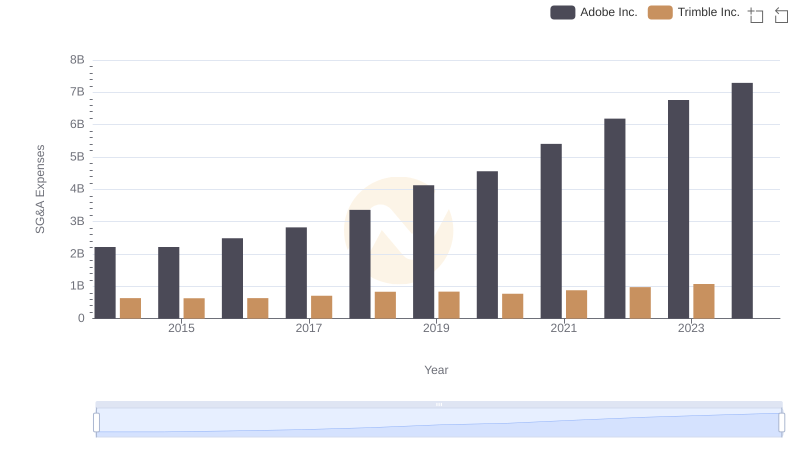
SG&A Efficiency Analysis: Comparing Adobe Inc. and Trimble Inc.
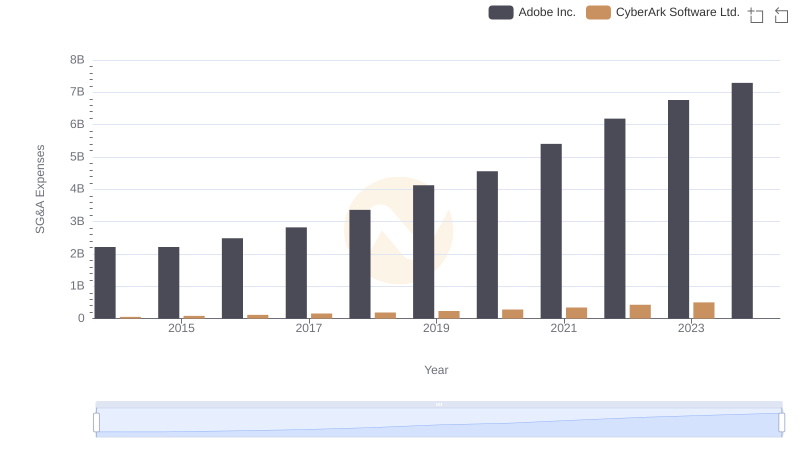
Adobe Inc. or CyberArk Software Ltd.: Who Manages SG&A Costs Better?
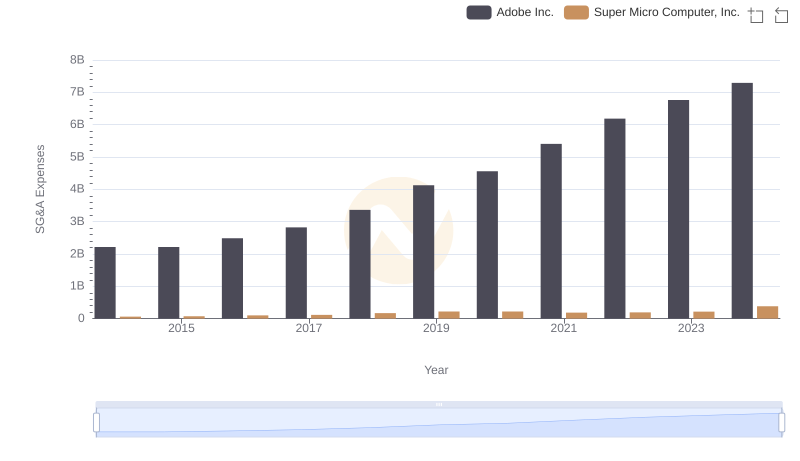
Who Optimizes SG&A Costs Better? Adobe Inc. or Super Micro Computer, Inc.
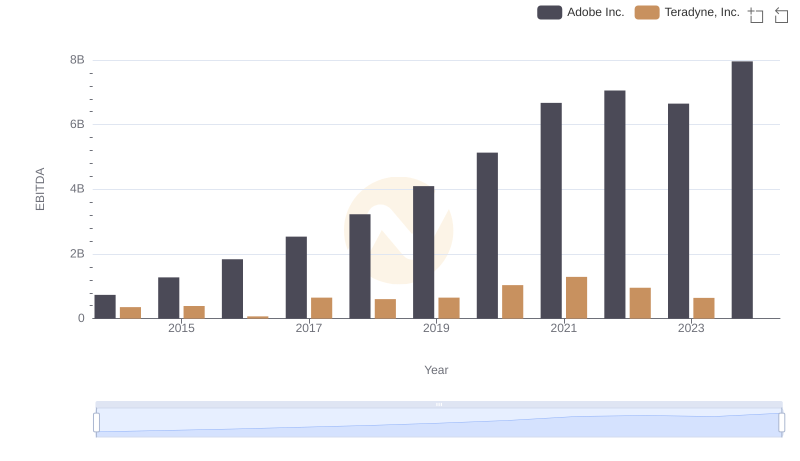
EBITDA Analysis: Evaluating Adobe Inc. Against Teradyne, Inc.
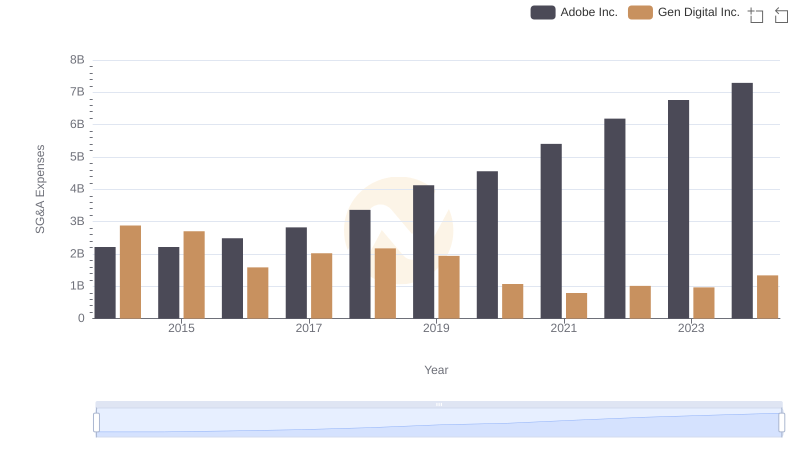
Cost Management Insights: SG&A Expenses for Adobe Inc. and Gen Digital Inc.
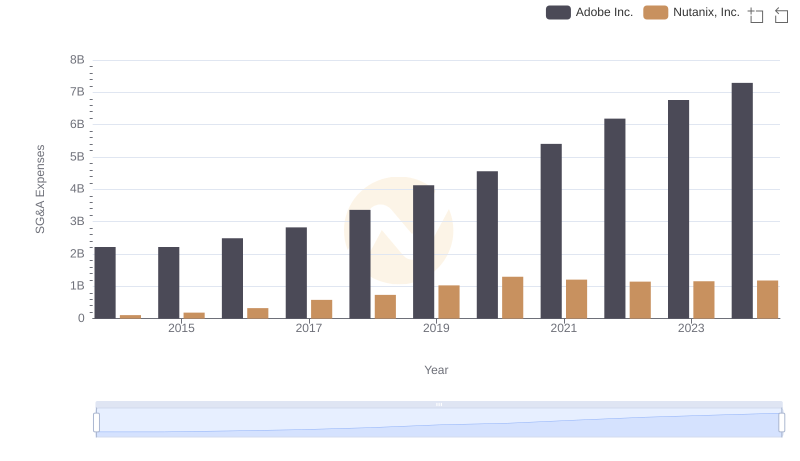
Cost Management Insights: SG&A Expenses for Adobe Inc. and Nutanix, Inc.
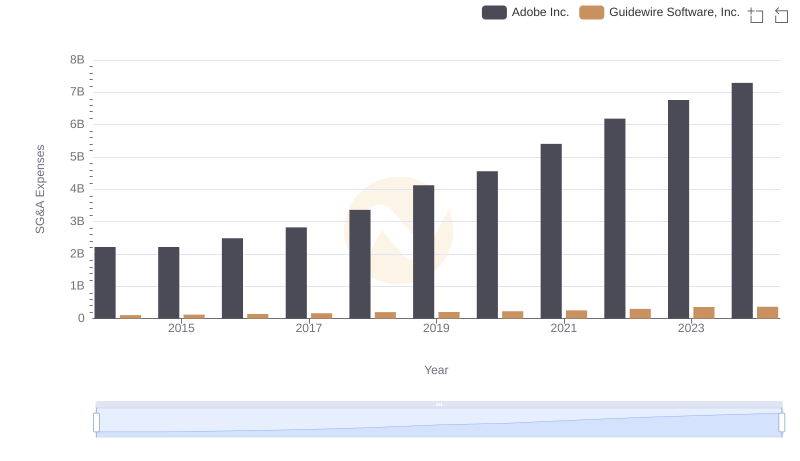
Adobe Inc. and Guidewire Software, Inc.: SG&A Spending Patterns Compared