| __timestamp | Adobe Inc. | Teradyne, Inc. |
|---|---|---|
| Wednesday, January 1, 2014 | 4147065000 | 1647824000 |
| Thursday, January 1, 2015 | 4795511000 | 1639578000 |
| Friday, January 1, 2016 | 5854430000 | 1753250000 |
| Sunday, January 1, 2017 | 7301505000 | 2136606000 |
| Monday, January 1, 2018 | 9030008000 | 2100802000 |
| Tuesday, January 1, 2019 | 11171297000 | 2294965000 |
| Wednesday, January 1, 2020 | 12868000000 | 3121469000 |
| Friday, January 1, 2021 | 15785000000 | 3702881000 |
| Saturday, January 1, 2022 | 17606000000 | 3155045000 |
| Sunday, January 1, 2023 | 19409000000 | 2676298000 |
| Monday, January 1, 2024 | 21505000000 | 2819880000 |
Infusing magic into the data realm
In the ever-evolving tech industry, revenue growth is a key indicator of a company's success. Over the past decade, Adobe Inc. has demonstrated a remarkable upward trajectory, with its revenue increasing by over 400% from 2014 to 2023. This growth reflects Adobe's strategic expansion and innovation in digital media and marketing solutions. In contrast, Teradyne, Inc., a leader in semiconductor testing, has experienced a more modest revenue increase of approximately 60% over the same period. Notably, Adobe's revenue in 2023 was nearly seven times that of Teradyne, highlighting its dominant market position. However, data for 2024 is incomplete, with Teradyne's figures yet to be reported. This comparison underscores the diverse growth strategies within the tech sector, where companies like Adobe leverage digital transformation, while Teradyne focuses on specialized industrial solutions.
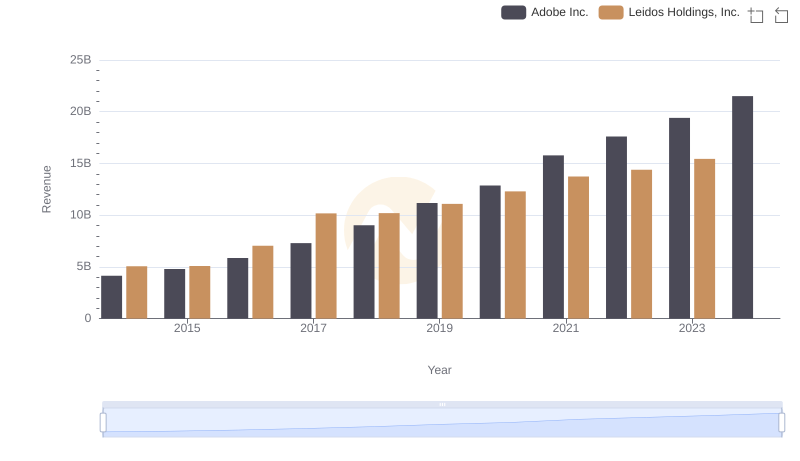
Adobe Inc. and Leidos Holdings, Inc.: A Comprehensive Revenue Analysis
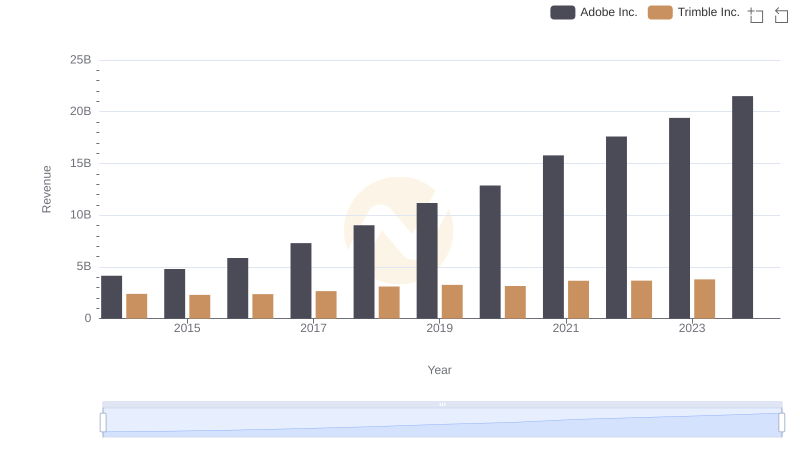
Breaking Down Revenue Trends: Adobe Inc. vs Trimble Inc.
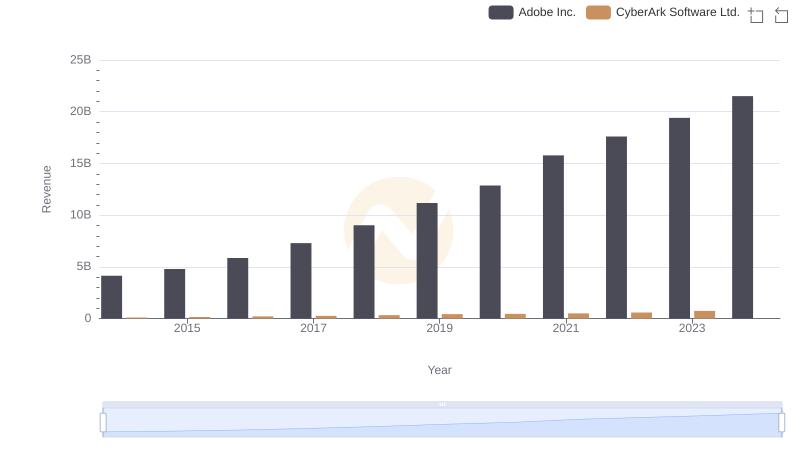
Revenue Showdown: Adobe Inc. vs CyberArk Software Ltd.
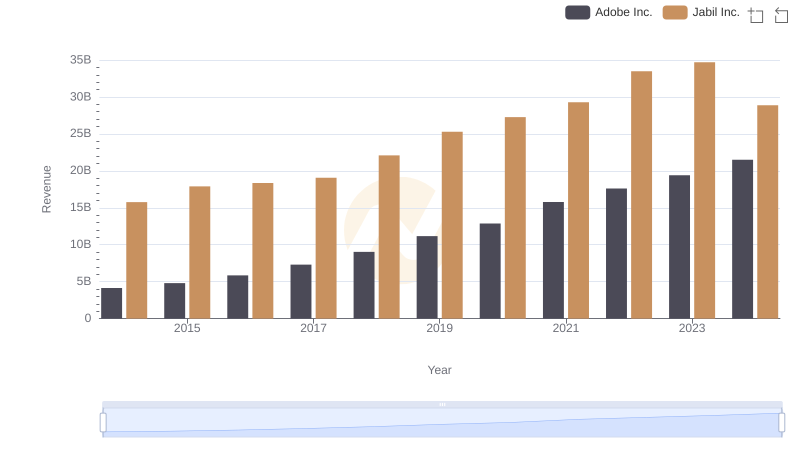
Adobe Inc. and Jabil Inc.: A Comprehensive Revenue Analysis
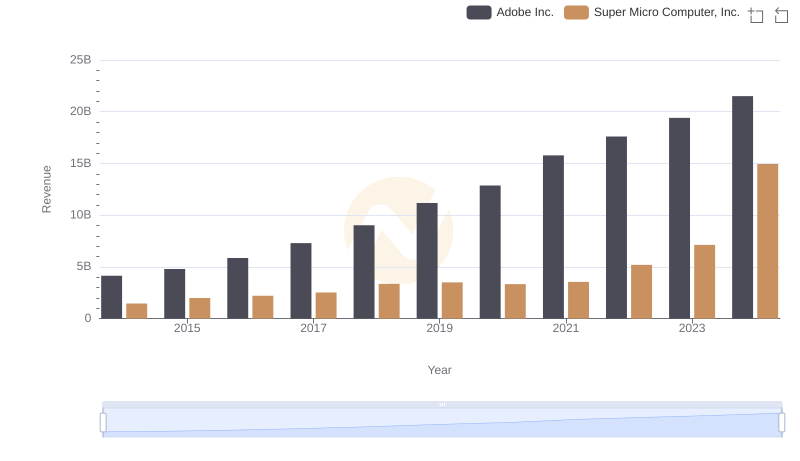
Comparing Revenue Performance: Adobe Inc. or Super Micro Computer, Inc.?

Adobe Inc. vs Teradyne, Inc.: Efficiency in Cost of Revenue Explored
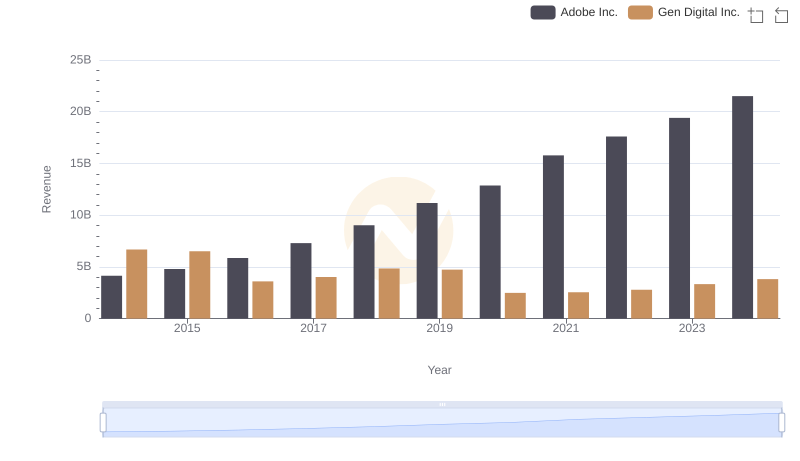
Who Generates More Revenue? Adobe Inc. or Gen Digital Inc.
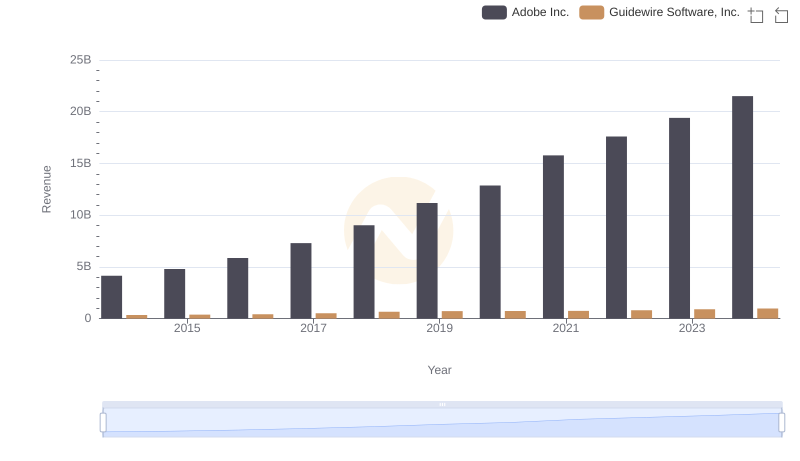
Comparing Revenue Performance: Adobe Inc. or Guidewire Software, Inc.?

Gross Profit Comparison: Adobe Inc. and Teradyne, Inc. Trends
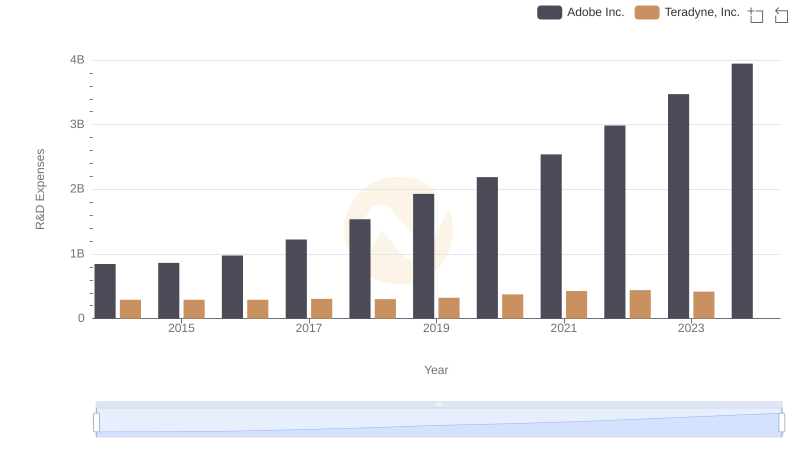
Who Prioritizes Innovation? R&D Spending Compared for Adobe Inc. and Teradyne, Inc.
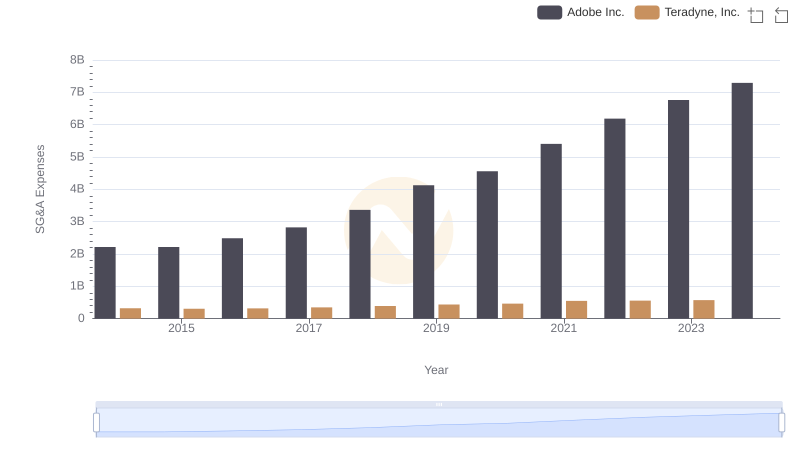
Breaking Down SG&A Expenses: Adobe Inc. vs Teradyne, Inc.
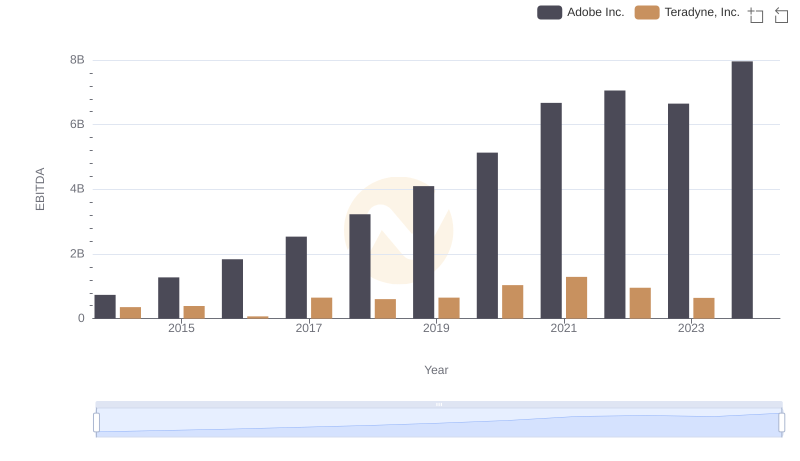
EBITDA Analysis: Evaluating Adobe Inc. Against Teradyne, Inc.