| __timestamp | Adobe Inc. | Teradyne, Inc. |
|---|---|---|
| Wednesday, January 1, 2014 | 3524985000 | 878808000 |
| Thursday, January 1, 2015 | 4051194000 | 915643000 |
| Friday, January 1, 2016 | 5034522000 | 959567000 |
| Sunday, January 1, 2017 | 6291014000 | 1223872000 |
| Monday, January 1, 2018 | 7835009000 | 1220394000 |
| Tuesday, January 1, 2019 | 9498577000 | 1339829000 |
| Wednesday, January 1, 2020 | 11146000000 | 1785741000 |
| Friday, January 1, 2021 | 13920000000 | 2206656000 |
| Saturday, January 1, 2022 | 15441000000 | 1867151000 |
| Sunday, January 1, 2023 | 17055000000 | 1536748000 |
| Monday, January 1, 2024 | 19147000000 | 1648927000 |
Igniting the spark of knowledge
In the ever-evolving landscape of technology, Adobe Inc. and Teradyne, Inc. have carved distinct paths over the past decade. From 2014 to 2023, Adobe's gross profit surged by an impressive 443%, reflecting its robust growth and market adaptability. In contrast, Teradyne, Inc. experienced a more modest increase of 75% during the same period, highlighting its steady yet slower growth trajectory.
Adobe's strategic innovations in digital media and marketing have propelled its financial success, with gross profits peaking at approximately $19 billion in 2023. Meanwhile, Teradyne, a leader in industrial automation and testing equipment, reached its highest gross profit of around $2.2 billion in 2021, before experiencing a slight decline.
This comparison underscores the dynamic nature of the tech industry, where companies must continuously innovate to maintain their competitive edge. As we look to the future, the question remains: how will these industry titans adapt to the next wave of technological advancements?
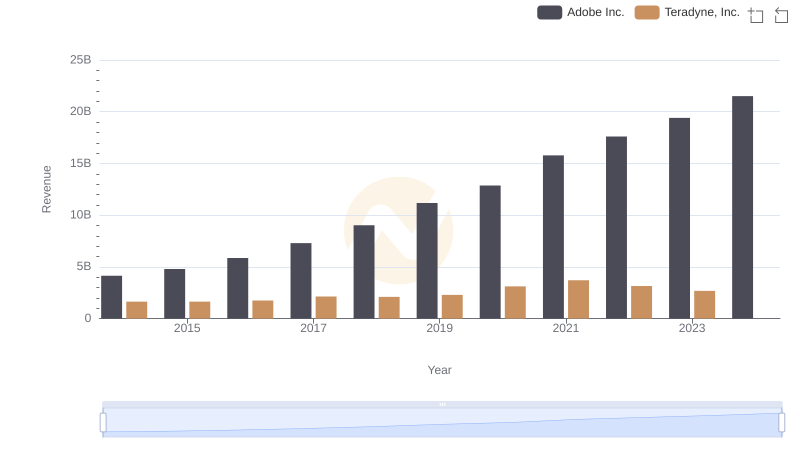
Revenue Insights: Adobe Inc. and Teradyne, Inc. Performance Compared
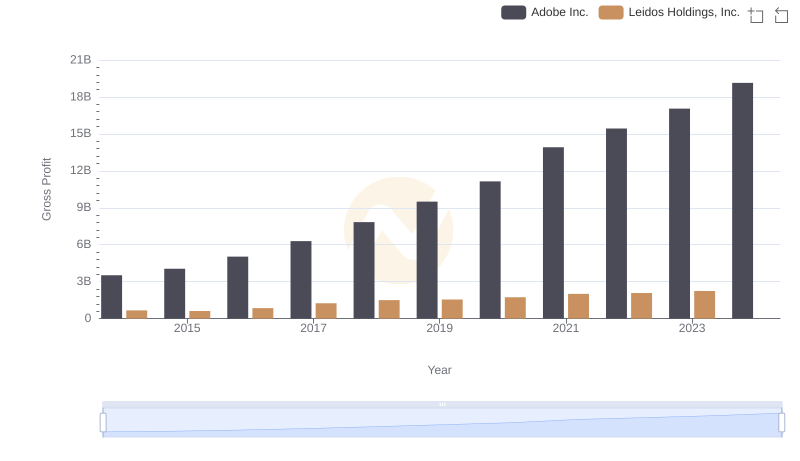
Who Generates Higher Gross Profit? Adobe Inc. or Leidos Holdings, Inc.

Adobe Inc. vs Teradyne, Inc.: Efficiency in Cost of Revenue Explored
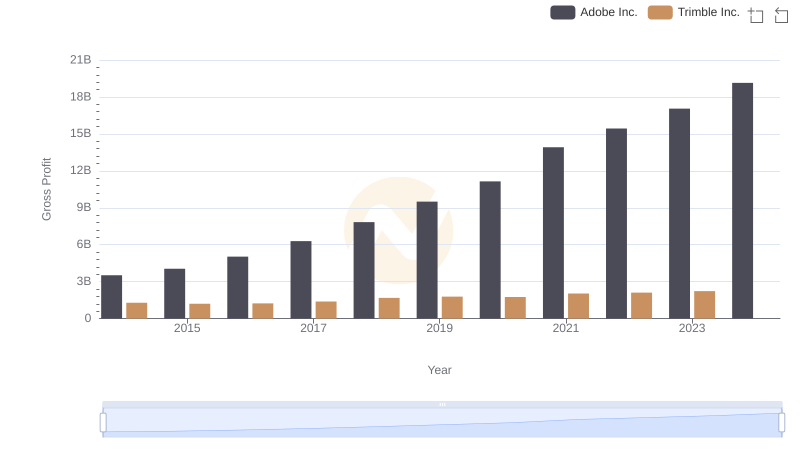
Who Generates Higher Gross Profit? Adobe Inc. or Trimble Inc.
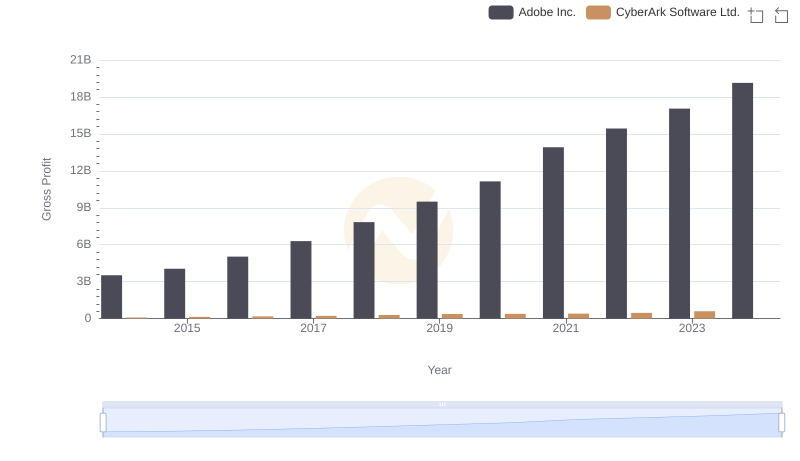
Who Generates Higher Gross Profit? Adobe Inc. or CyberArk Software Ltd.
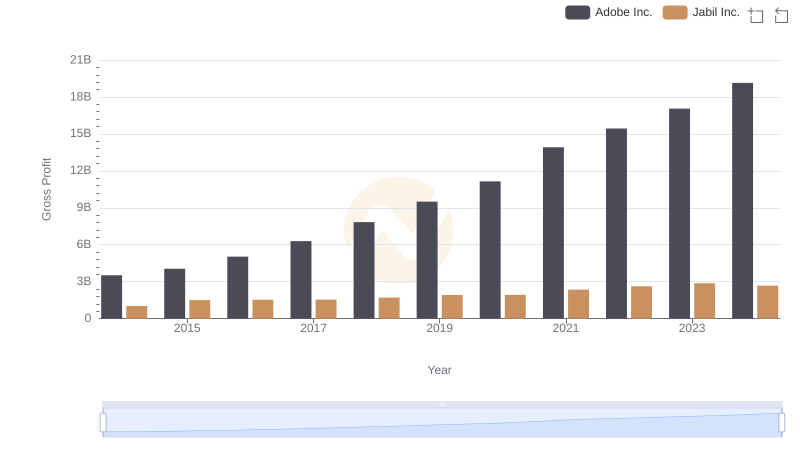
Gross Profit Trends Compared: Adobe Inc. vs Jabil Inc.
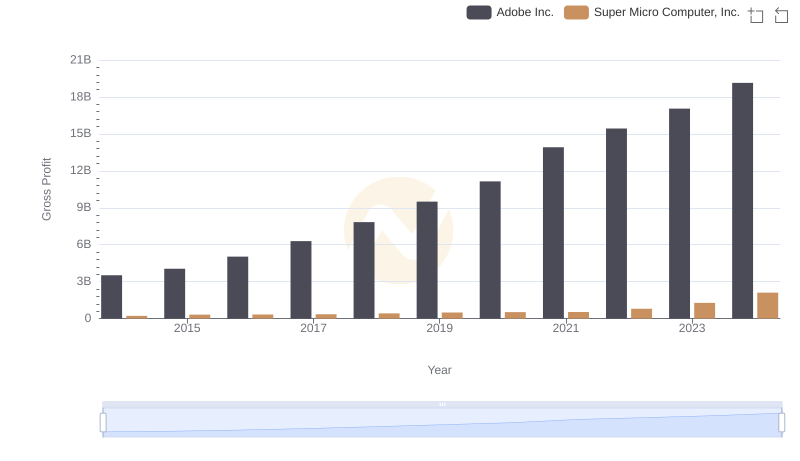
Adobe Inc. and Super Micro Computer, Inc.: A Detailed Gross Profit Analysis
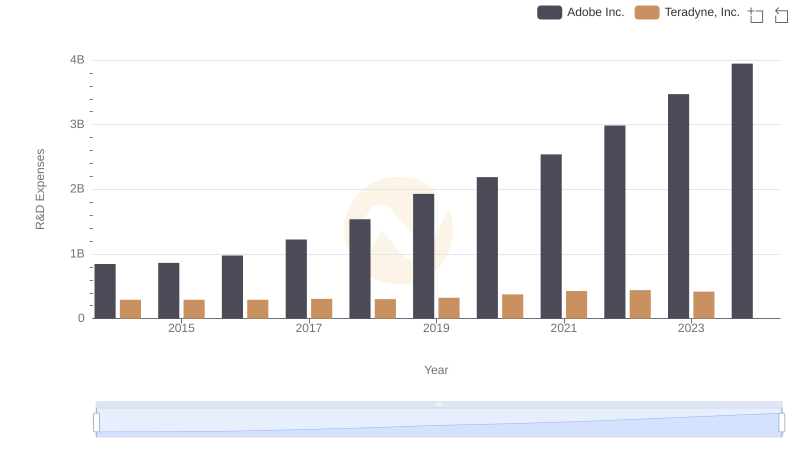
Who Prioritizes Innovation? R&D Spending Compared for Adobe Inc. and Teradyne, Inc.
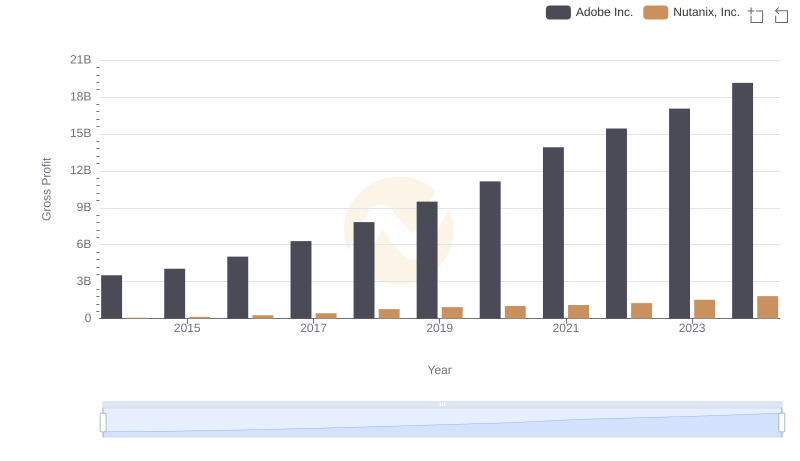
Adobe Inc. and Nutanix, Inc.: A Detailed Gross Profit Analysis
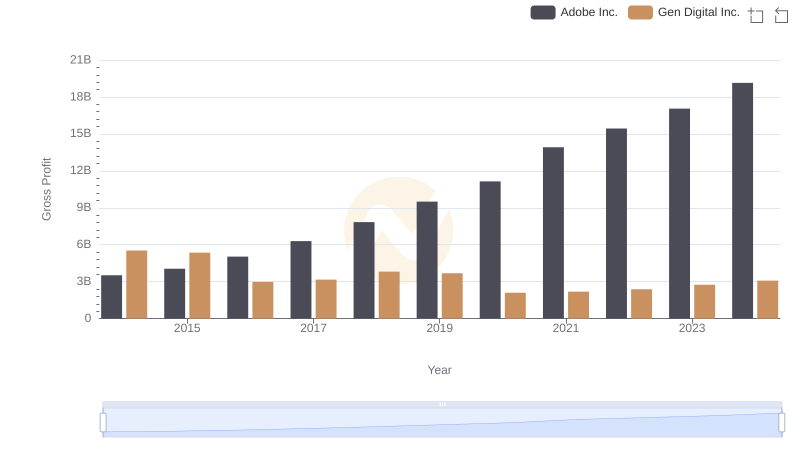
Adobe Inc. and Gen Digital Inc.: A Detailed Gross Profit Analysis
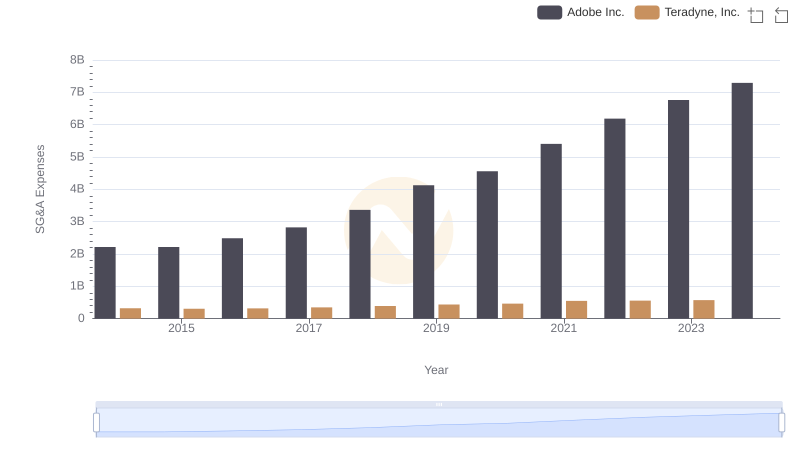
Breaking Down SG&A Expenses: Adobe Inc. vs Teradyne, Inc.
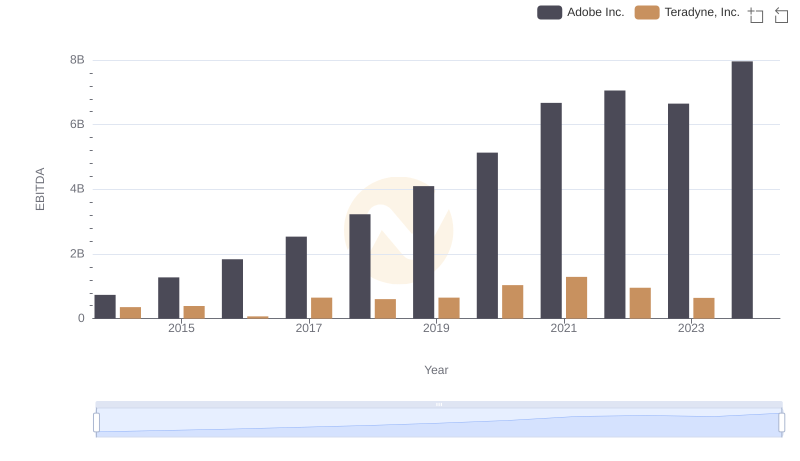
EBITDA Analysis: Evaluating Adobe Inc. Against Teradyne, Inc.