| __timestamp | 3M Company | Fastenal Company |
|---|---|---|
| Wednesday, January 1, 2014 | 31821000000 | 3733507000 |
| Thursday, January 1, 2015 | 30274000000 | 3869187000 |
| Friday, January 1, 2016 | 30109000000 | 3962036000 |
| Sunday, January 1, 2017 | 31657000000 | 4390500000 |
| Monday, January 1, 2018 | 32765000000 | 4965100000 |
| Tuesday, January 1, 2019 | 32136000000 | 5333700000 |
| Wednesday, January 1, 2020 | 32184000000 | 5647300000 |
| Friday, January 1, 2021 | 35355000000 | 6010900000 |
| Saturday, January 1, 2022 | 34229000000 | 6980600000 |
| Sunday, January 1, 2023 | 32681000000 | 7346700000 |
| Monday, January 1, 2024 | 24575000000 | 7546000000 |
Unlocking the unknown
In the competitive landscape of industrial giants, 3M Company and Fastenal Company have been vying for the top spot in annual revenue. Over the past decade, 3M has consistently outpaced Fastenal, boasting revenues that are approximately five times higher. However, Fastenal has shown impressive growth, with its revenue increasing by nearly 102% from 2014 to 2023.
From 2014 to 2023, 3M's revenue peaked in 2021, reaching a staggering $35.4 billion, while Fastenal's revenue steadily climbed, reaching $7.3 billion in 2023. Despite 3M's larger revenue base, Fastenal's growth trajectory is noteworthy, reflecting its strategic expansion and market penetration.
As we move into 2024, Fastenal's revenue continues to rise, while 3M faces a dip. This shift could signal a changing dynamic in the industrial sector, making it a fascinating space to watch.
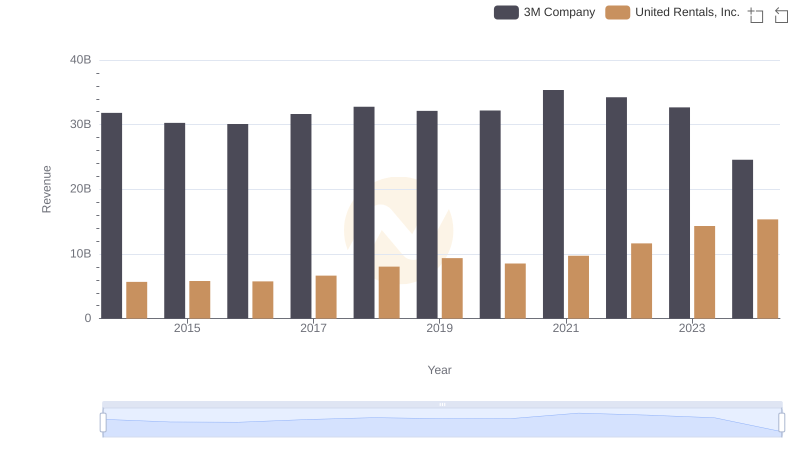
Who Generates More Revenue? 3M Company or United Rentals, Inc.
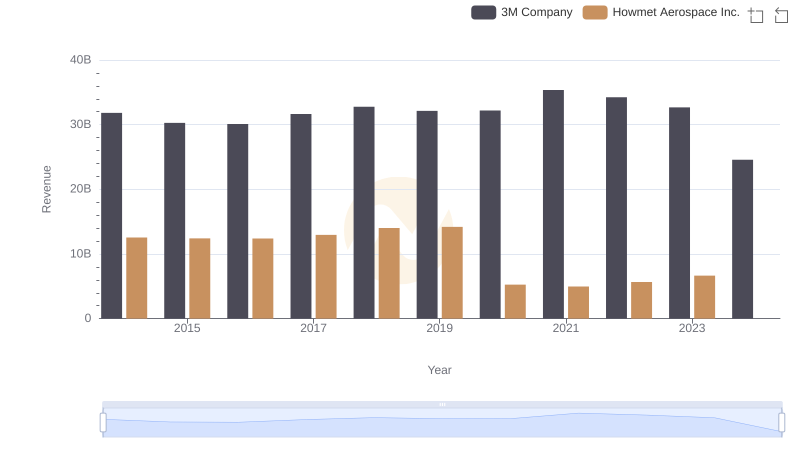
Annual Revenue Comparison: 3M Company vs Howmet Aerospace Inc.
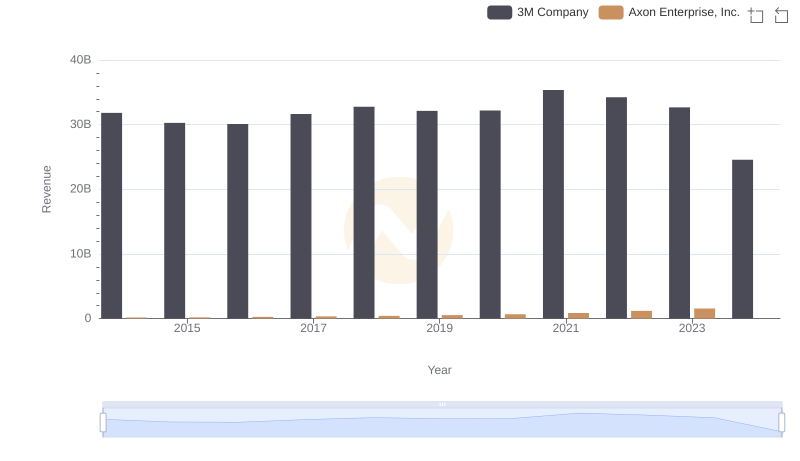
Revenue Showdown: 3M Company vs Axon Enterprise, Inc.
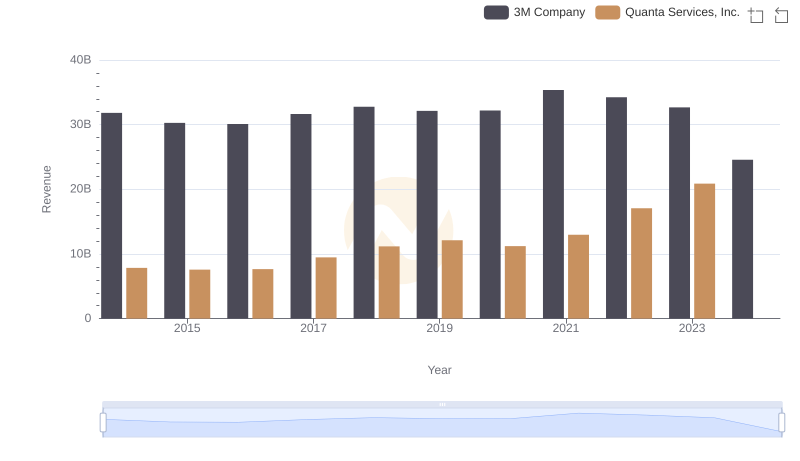
Comparing Revenue Performance: 3M Company or Quanta Services, Inc.?
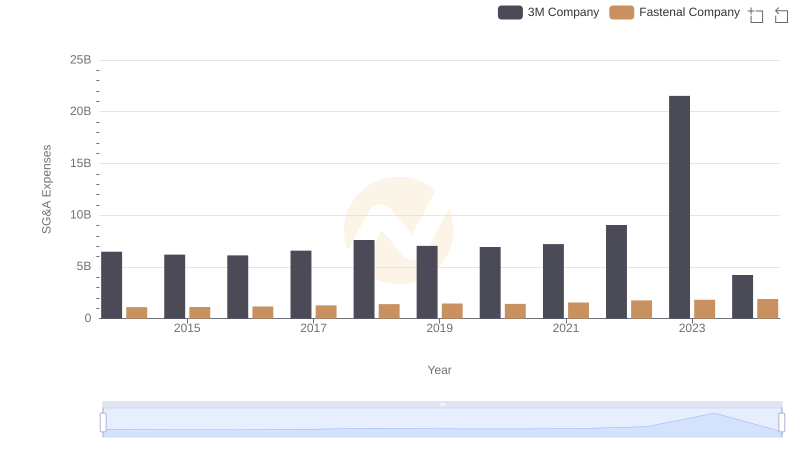
Breaking Down SG&A Expenses: 3M Company vs Fastenal Company