| __timestamp | International Business Machines Corporation | Wipro Limited |
|---|---|---|
| Wednesday, January 1, 2014 | 92793000000 | 469545000000 |
| Thursday, January 1, 2015 | 81742000000 | 512440000000 |
| Friday, January 1, 2016 | 79920000000 | 550402000000 |
| Sunday, January 1, 2017 | 79139000000 | 544871000000 |
| Monday, January 1, 2018 | 79591000000 | 585845000000 |
| Tuesday, January 1, 2019 | 57714000000 | 610232000000 |
| Wednesday, January 1, 2020 | 55179000000 | 619430000000 |
| Friday, January 1, 2021 | 57351000000 | 790934000000 |
| Saturday, January 1, 2022 | 60530000000 | 904876000000 |
| Sunday, January 1, 2023 | 61860000000 | 897603000000 |
| Monday, January 1, 2024 | 62753000000 | 897603000000 |
Unlocking the unknown
In the ever-evolving landscape of global technology, International Business Machines Corporation (IBM) and Wipro Limited stand as titans. Over the past decade, these companies have navigated the turbulent waters of the tech industry, showcasing resilience and adaptability. From 2014 to 2024, IBM's revenue has seen a decline of approximately 32%, dropping from $92.8 billion to $62.8 billion. This trend reflects the challenges faced by traditional tech giants in adapting to new market demands.
Conversely, Wipro has experienced a remarkable growth trajectory, with its revenue surging by nearly 91% from $469.5 billion to $897.6 billion. This growth underscores Wipro's strategic pivot towards digital transformation and global expansion. As we delve into these figures, it becomes evident that while IBM is recalibrating its strategies, Wipro is capitalizing on emerging opportunities, setting a benchmark for innovation and growth in the tech sector.
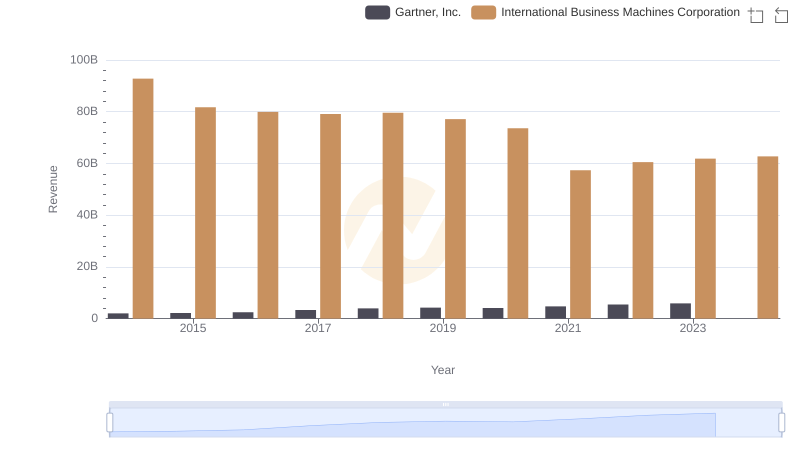
International Business Machines Corporation vs Gartner, Inc.: Examining Key Revenue Metrics
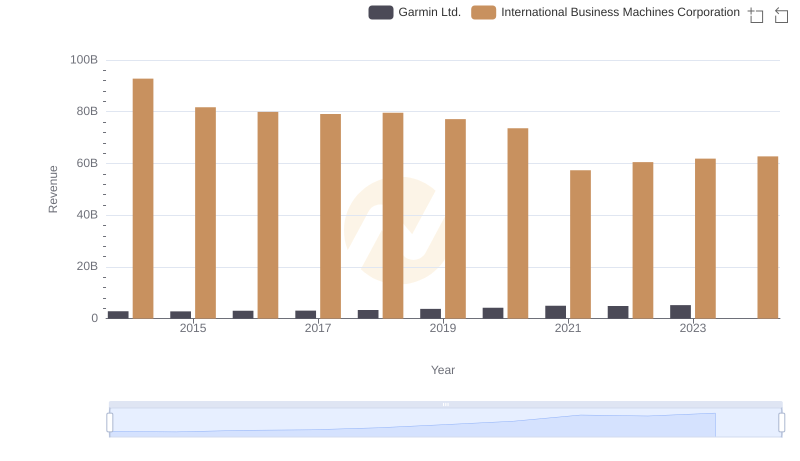
International Business Machines Corporation vs Garmin Ltd.: Examining Key Revenue Metrics
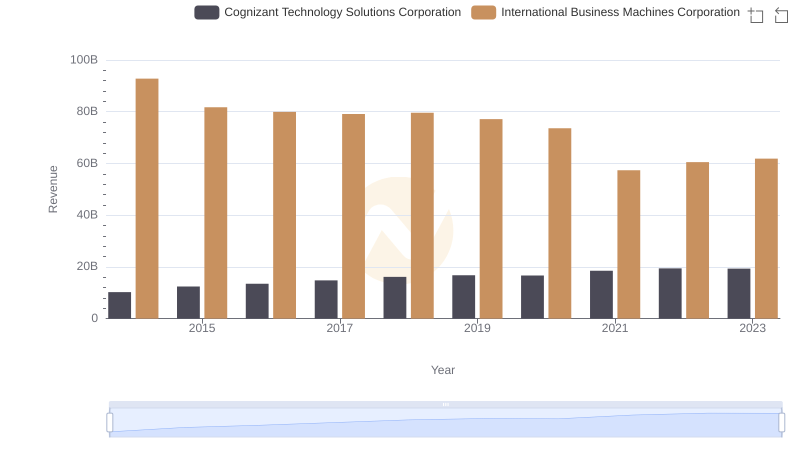
Breaking Down Revenue Trends: International Business Machines Corporation vs Cognizant Technology Solutions Corporation
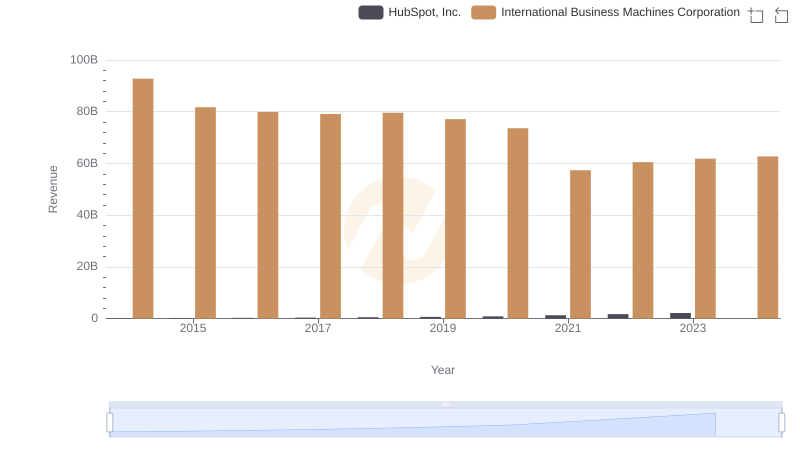
Who Generates More Revenue? International Business Machines Corporation or HubSpot, Inc.
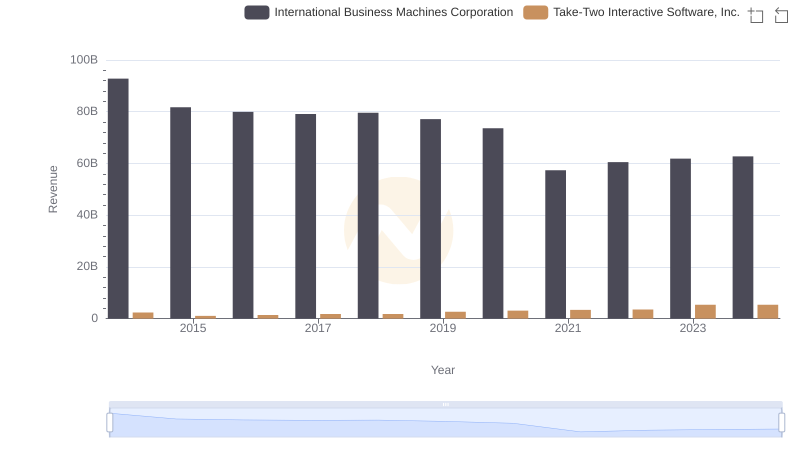
Breaking Down Revenue Trends: International Business Machines Corporation vs Take-Two Interactive Software, Inc.
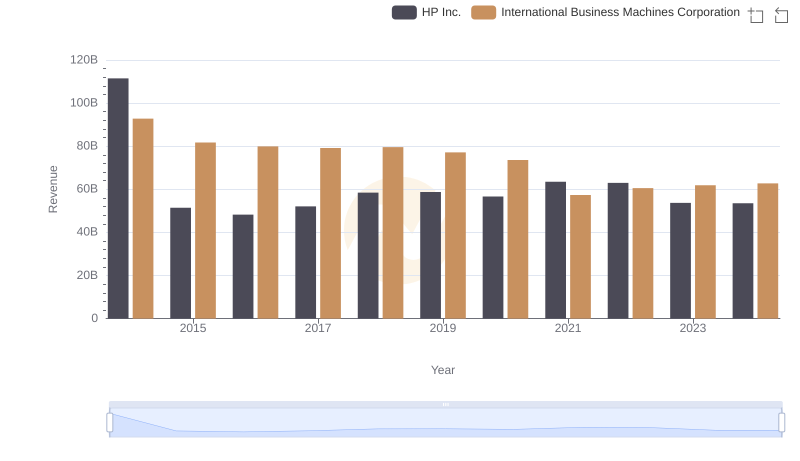
International Business Machines Corporation and HP Inc.: A Comprehensive Revenue Analysis
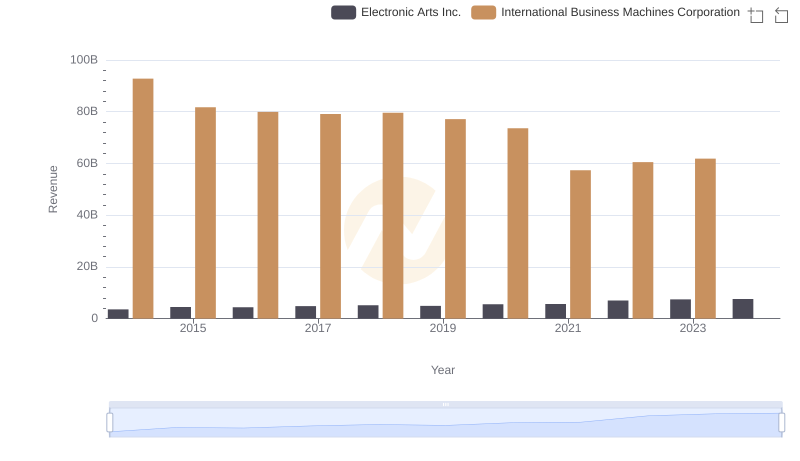
Comparing Revenue Performance: International Business Machines Corporation or Electronic Arts Inc.?
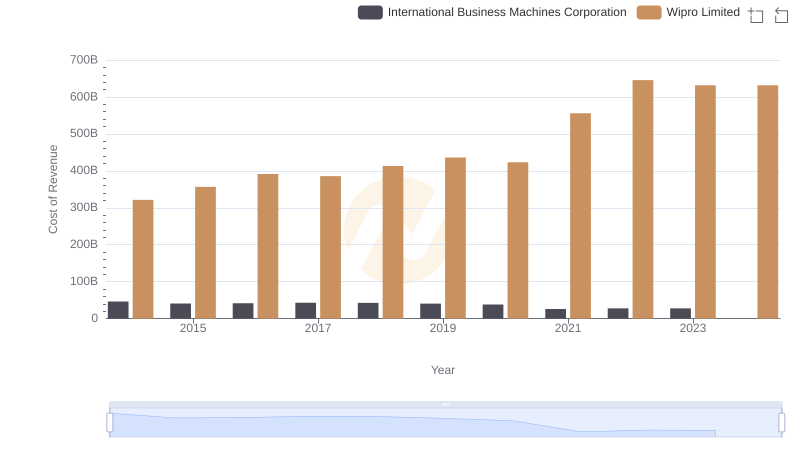
Analyzing Cost of Revenue: International Business Machines Corporation and Wipro Limited
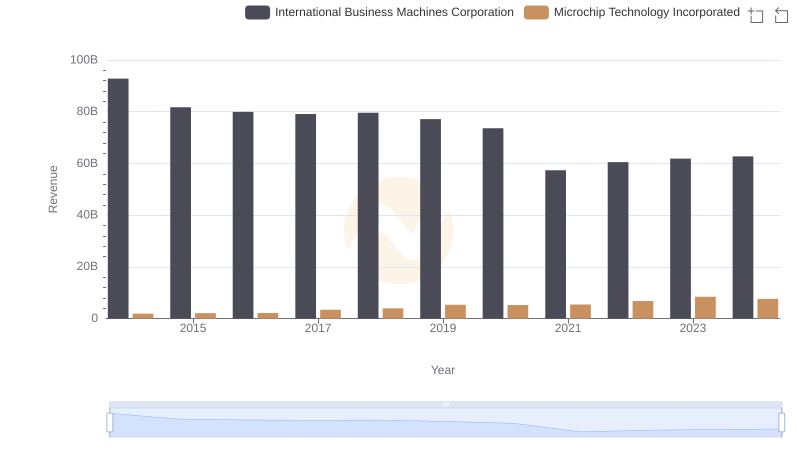
Annual Revenue Comparison: International Business Machines Corporation vs Microchip Technology Incorporated
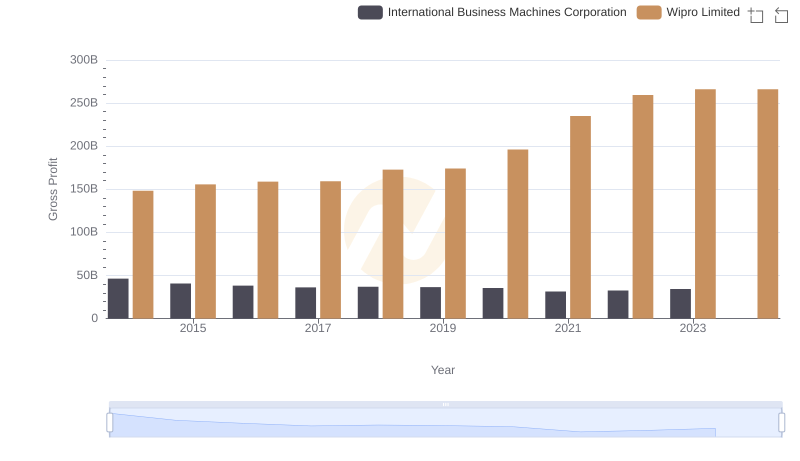
Who Generates Higher Gross Profit? International Business Machines Corporation or Wipro Limited
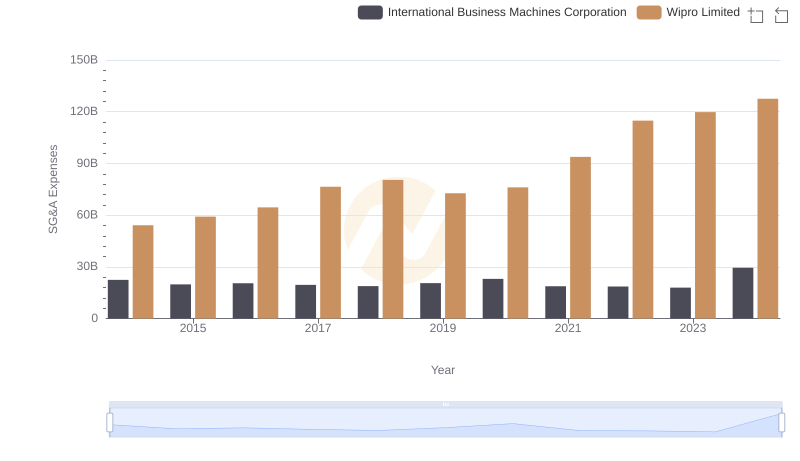
Selling, General, and Administrative Costs: International Business Machines Corporation vs Wipro Limited
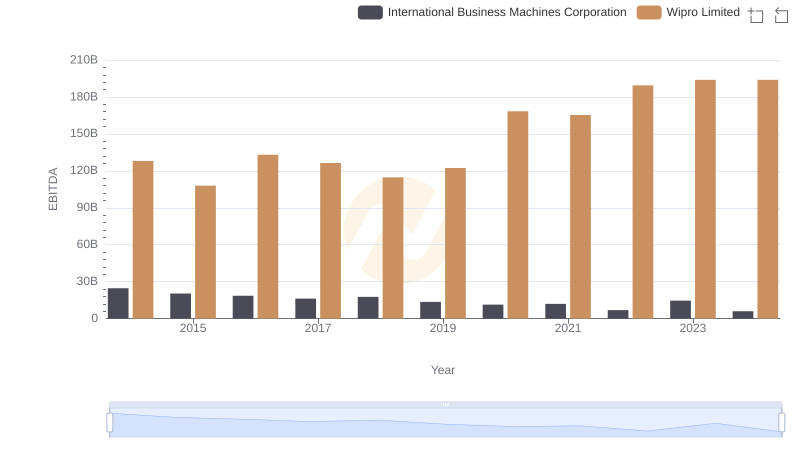
International Business Machines Corporation vs Wipro Limited: In-Depth EBITDA Performance Comparison