| __timestamp | Ingersoll Rand Inc. | Rockwell Automation, Inc. |
|---|---|---|
| Wednesday, January 1, 2014 | 2570005000 | 6623500000 |
| Thursday, January 1, 2015 | 2126900000 | 6307900000 |
| Friday, January 1, 2016 | 1939436000 | 5879500000 |
| Sunday, January 1, 2017 | 2375400000 | 6311300000 |
| Monday, January 1, 2018 | 2689800000 | 6666000000 |
| Tuesday, January 1, 2019 | 2451900000 | 6694800000 |
| Wednesday, January 1, 2020 | 4910200000 | 6329800000 |
| Friday, January 1, 2021 | 5152400000 | 6997400000 |
| Saturday, January 1, 2022 | 5916300000 | 7760400000 |
| Sunday, January 1, 2023 | 6876100000 | 9058000000 |
| Monday, January 1, 2024 | 0 | 8264200000 |
Igniting the spark of knowledge
In the ever-evolving landscape of industrial technology, Ingersoll Rand Inc. and Rockwell Automation, Inc. have showcased intriguing revenue trajectories over the past decade. From 2014 to 2023, Rockwell Automation consistently outperformed Ingersoll Rand, with revenues peaking at approximately $9.1 billion in 2023, marking a 37% increase from 2014. In contrast, Ingersoll Rand's revenue growth was more volatile, yet impressive, with a 168% surge from 2016 to 2023, reaching nearly $6.9 billion. This period highlights a significant recovery and growth phase for Ingersoll Rand, especially post-2020. The data for 2024 remains incomplete, leaving room for speculation on future trends. As these industrial giants continue to innovate, their financial trajectories offer valuable insights into the sector's dynamics and potential future shifts.
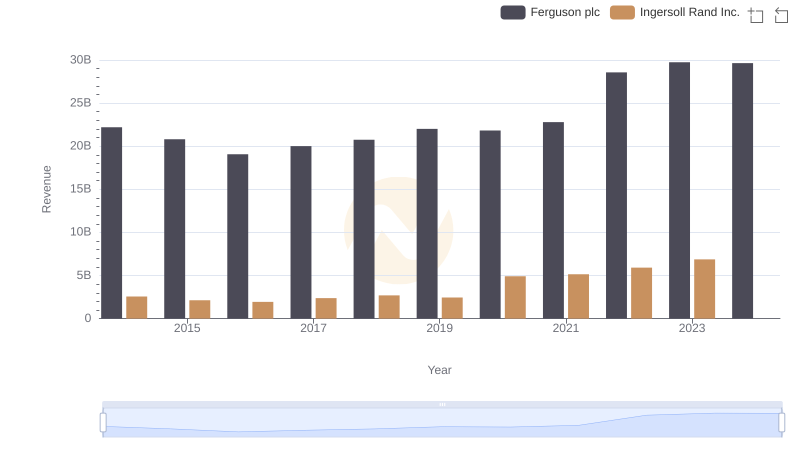
Ingersoll Rand Inc. vs Ferguson plc: Examining Key Revenue Metrics
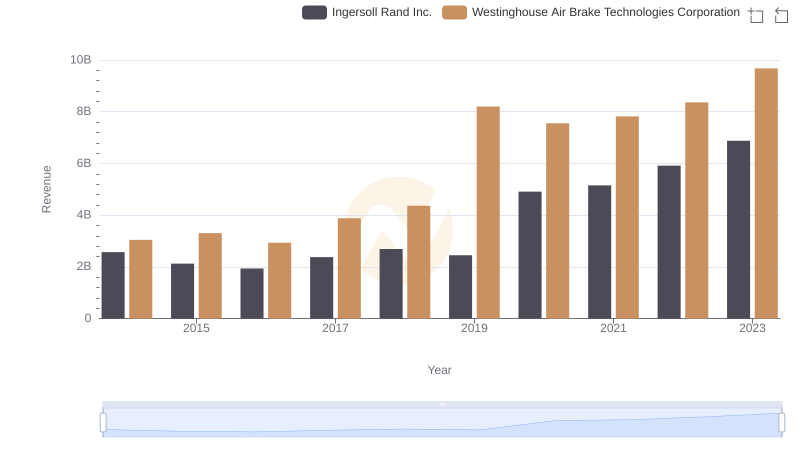
Revenue Insights: Ingersoll Rand Inc. and Westinghouse Air Brake Technologies Corporation Performance Compared
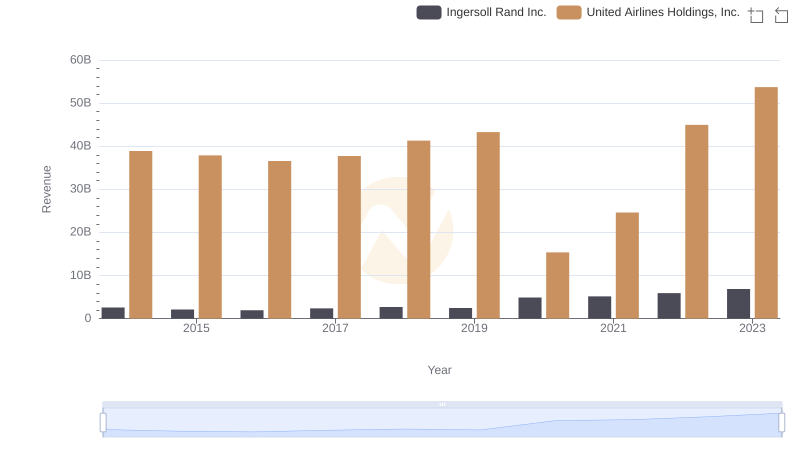
Ingersoll Rand Inc. or United Airlines Holdings, Inc.: Who Leads in Yearly Revenue?
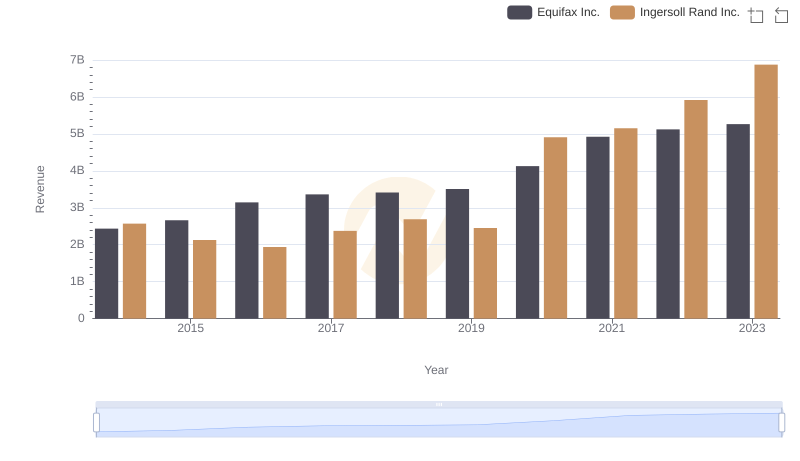
Ingersoll Rand Inc. vs Equifax Inc.: Examining Key Revenue Metrics
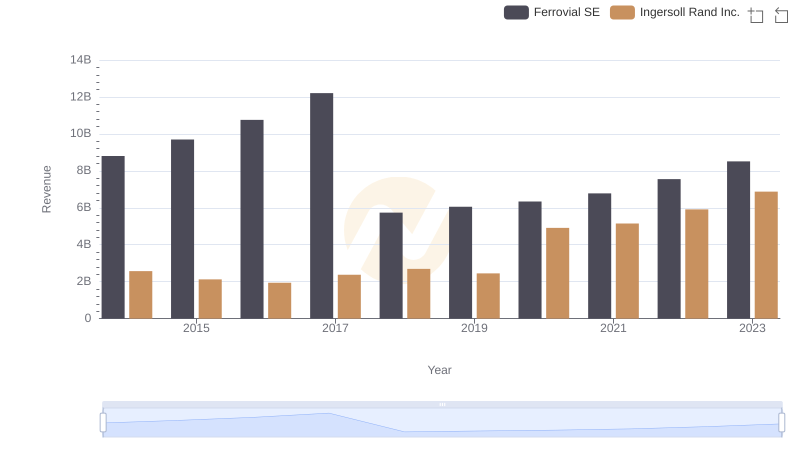
Comparing Revenue Performance: Ingersoll Rand Inc. or Ferrovial SE?
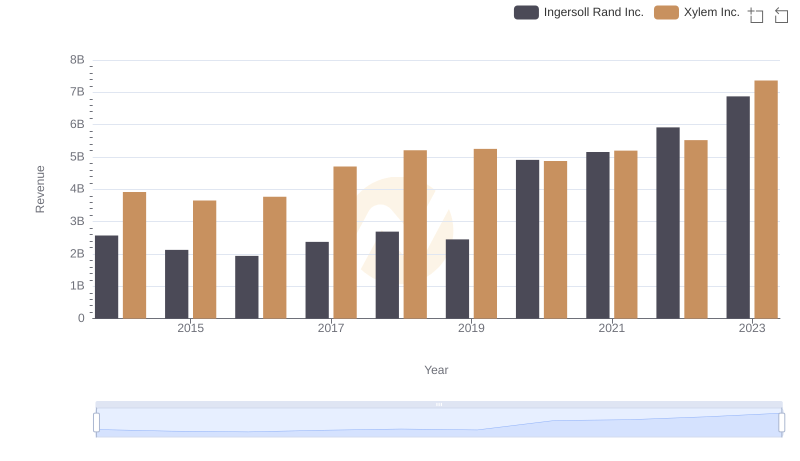
Revenue Insights: Ingersoll Rand Inc. and Xylem Inc. Performance Compared
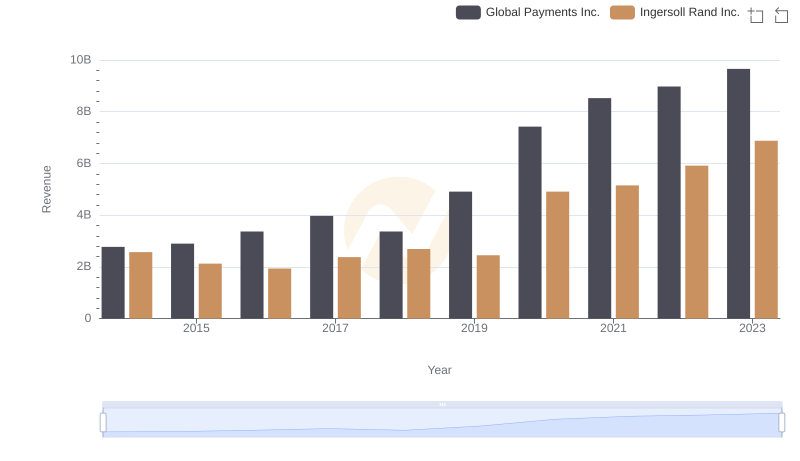
Ingersoll Rand Inc. and Global Payments Inc.: A Comprehensive Revenue Analysis
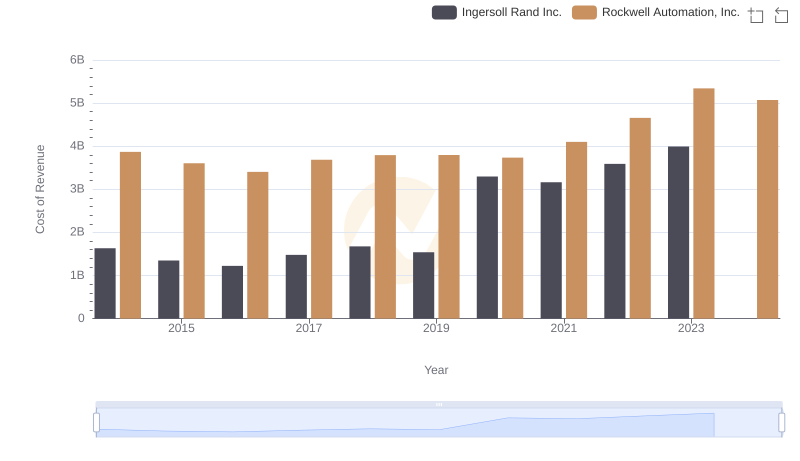
Cost of Revenue Trends: Ingersoll Rand Inc. vs Rockwell Automation, Inc.
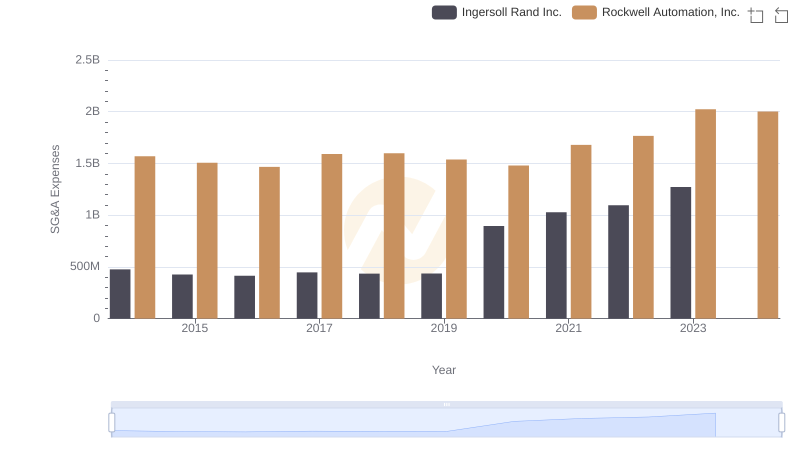
Comparing SG&A Expenses: Ingersoll Rand Inc. vs Rockwell Automation, Inc. Trends and Insights