| __timestamp | Ingersoll Rand Inc. | Rockwell Automation, Inc. |
|---|---|---|
| Wednesday, January 1, 2014 | 1633224000 | 3869600000 |
| Thursday, January 1, 2015 | 1347800000 | 3604800000 |
| Friday, January 1, 2016 | 1222705000 | 3404000000 |
| Sunday, January 1, 2017 | 1477500000 | 3687100000 |
| Monday, January 1, 2018 | 1677300000 | 3793800000 |
| Tuesday, January 1, 2019 | 1540200000 | 3794700000 |
| Wednesday, January 1, 2020 | 3296800000 | 3734600000 |
| Friday, January 1, 2021 | 3163900000 | 4099700000 |
| Saturday, January 1, 2022 | 3590700000 | 4658400000 |
| Sunday, January 1, 2023 | 3993900000 | 5341000000 |
| Monday, January 1, 2024 | 0 | 5070800000 |
Igniting the spark of knowledge
In the ever-evolving landscape of industrial manufacturing, understanding cost dynamics is crucial. Over the past decade, Ingersoll Rand Inc. and Rockwell Automation, Inc. have showcased distinct trends in their cost of revenue. From 2014 to 2023, Ingersoll Rand's cost of revenue surged by approximately 145%, peaking in 2023. This reflects strategic expansions and possibly increased operational costs. In contrast, Rockwell Automation experienced a steadier growth of around 38% over the same period, indicating a more controlled cost management approach. Notably, 2020 marked a significant spike for Ingersoll Rand, with costs nearly doubling from the previous year, possibly due to acquisitions or market shifts. Meanwhile, Rockwell Automation's costs consistently rose, reaching their zenith in 2023. These trends highlight the differing strategies and market responses of these industrial giants, offering valuable insights for investors and industry analysts alike.
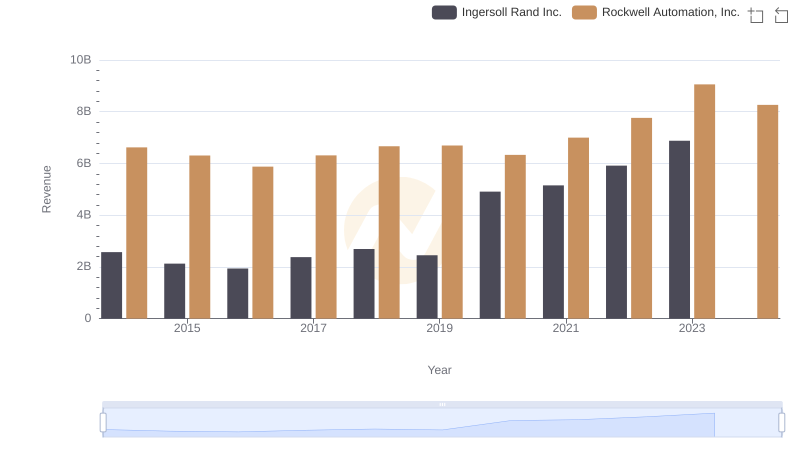
Breaking Down Revenue Trends: Ingersoll Rand Inc. vs Rockwell Automation, Inc.
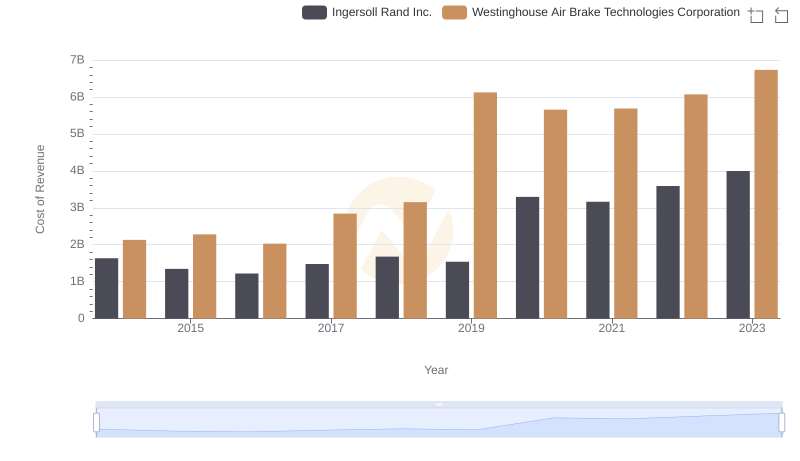
Cost of Revenue Comparison: Ingersoll Rand Inc. vs Westinghouse Air Brake Technologies Corporation
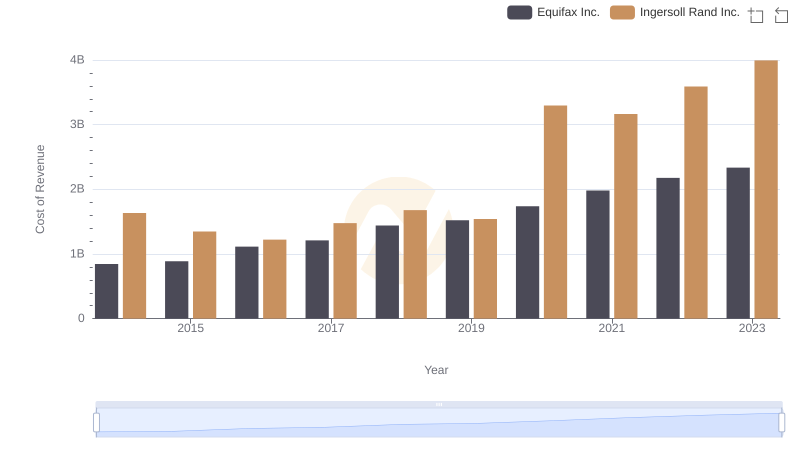
Cost of Revenue: Key Insights for Ingersoll Rand Inc. and Equifax Inc.
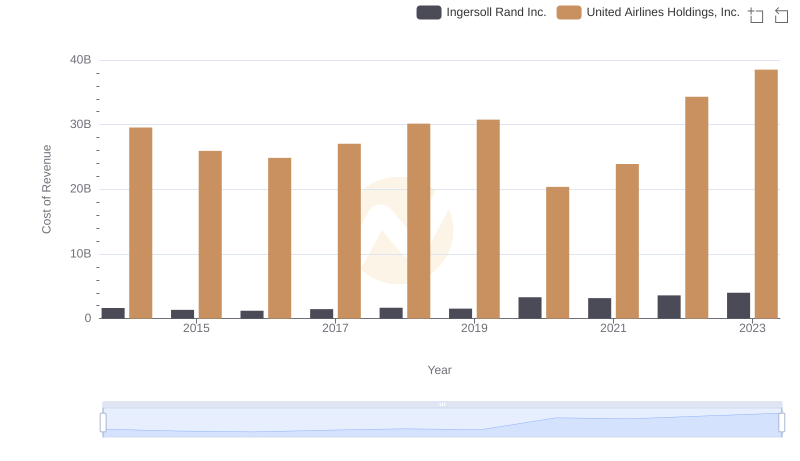
Cost Insights: Breaking Down Ingersoll Rand Inc. and United Airlines Holdings, Inc.'s Expenses
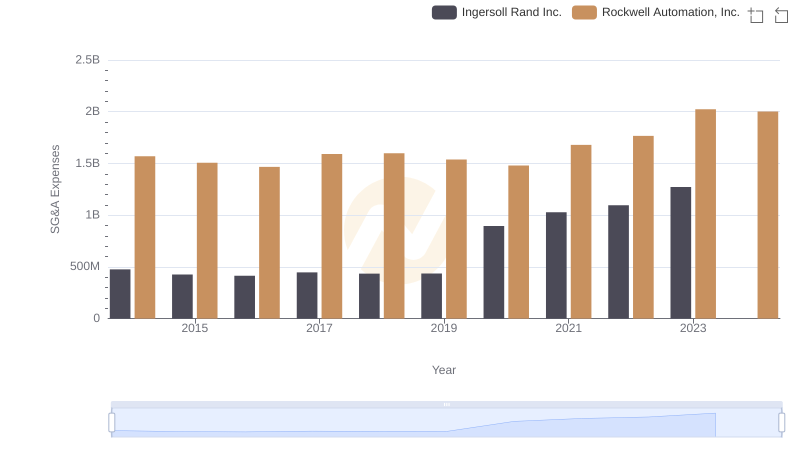
Comparing SG&A Expenses: Ingersoll Rand Inc. vs Rockwell Automation, Inc. Trends and Insights