| __timestamp | Ingersoll Rand Inc. | Xylem Inc. |
|---|---|---|
| Wednesday, January 1, 2014 | 2570005000 | 3916000000 |
| Thursday, January 1, 2015 | 2126900000 | 3653000000 |
| Friday, January 1, 2016 | 1939436000 | 3771000000 |
| Sunday, January 1, 2017 | 2375400000 | 4707000000 |
| Monday, January 1, 2018 | 2689800000 | 5207000000 |
| Tuesday, January 1, 2019 | 2451900000 | 5249000000 |
| Wednesday, January 1, 2020 | 4910200000 | 4876000000 |
| Friday, January 1, 2021 | 5152400000 | 5195000000 |
| Saturday, January 1, 2022 | 5916300000 | 5522000000 |
| Sunday, January 1, 2023 | 6876100000 | 7364000000 |
| Monday, January 1, 2024 | 0 |
Infusing magic into the data realm
In the dynamic world of industrial manufacturing, Ingersoll Rand Inc. and Xylem Inc. have showcased remarkable revenue trajectories over the past decade. From 2014 to 2023, Ingersoll Rand's revenue surged by approximately 168%, reflecting its strategic expansions and market adaptability. Meanwhile, Xylem Inc. demonstrated a robust growth of around 88%, driven by its innovative solutions in water technology.
This comparative analysis highlights the evolving competitive landscape and the strategic maneuvers that have defined these industry giants.
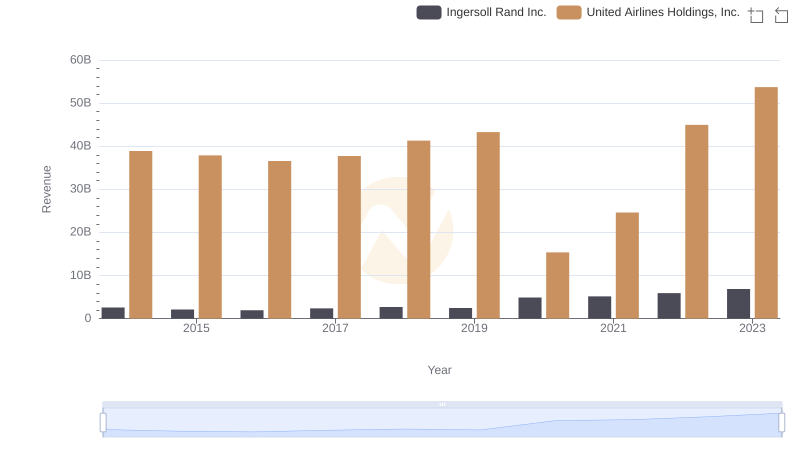
Ingersoll Rand Inc. or United Airlines Holdings, Inc.: Who Leads in Yearly Revenue?
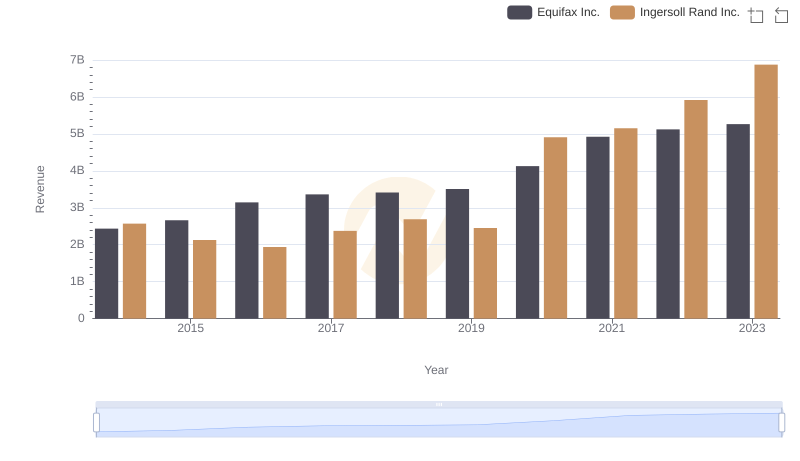
Ingersoll Rand Inc. vs Equifax Inc.: Examining Key Revenue Metrics
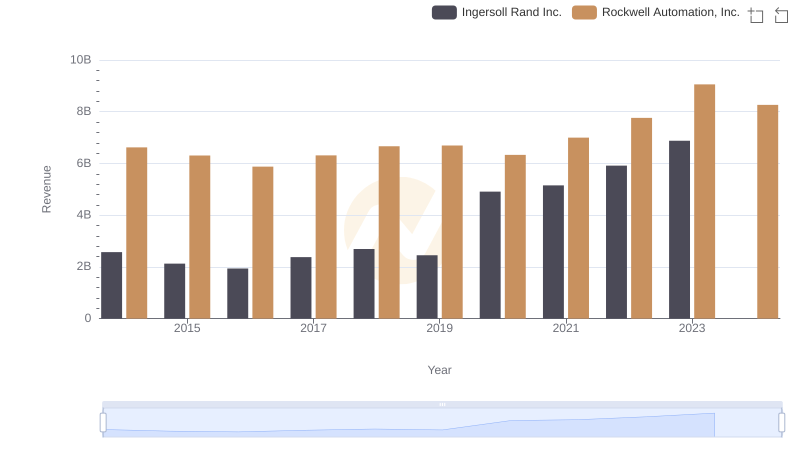
Breaking Down Revenue Trends: Ingersoll Rand Inc. vs Rockwell Automation, Inc.
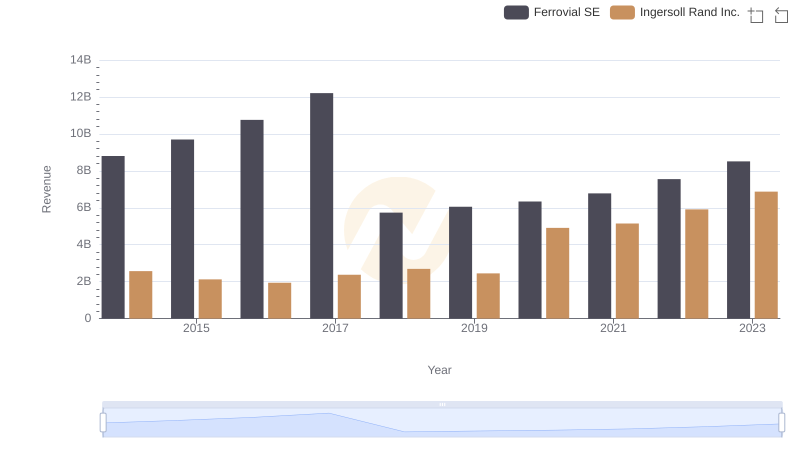
Comparing Revenue Performance: Ingersoll Rand Inc. or Ferrovial SE?
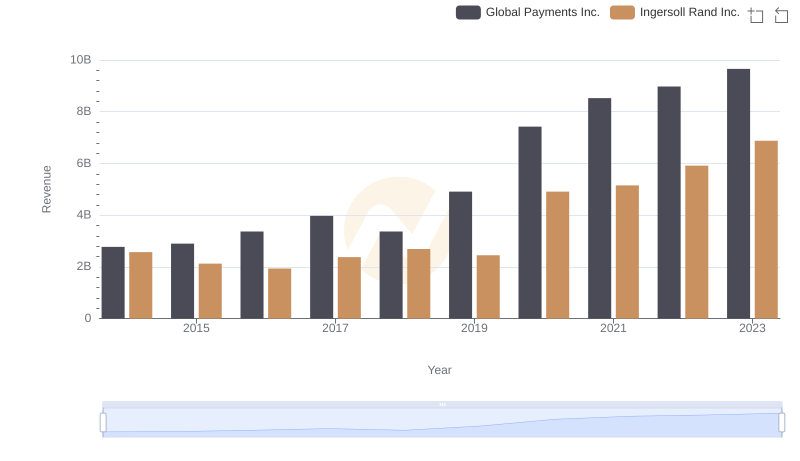
Ingersoll Rand Inc. and Global Payments Inc.: A Comprehensive Revenue Analysis
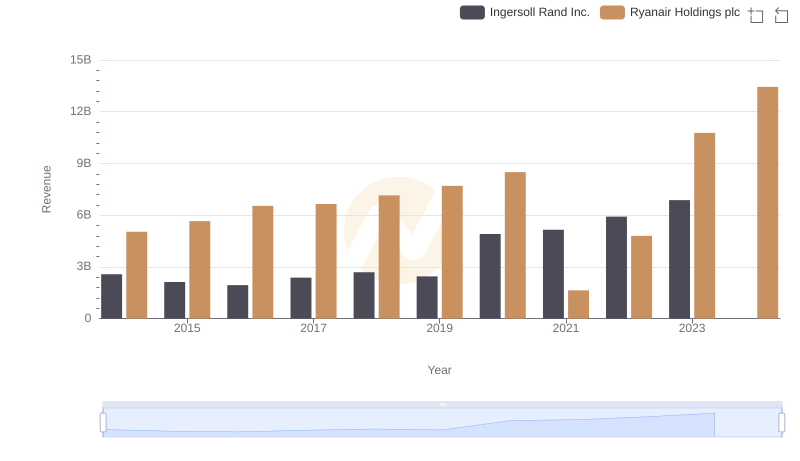
Comparing Revenue Performance: Ingersoll Rand Inc. or Ryanair Holdings plc?
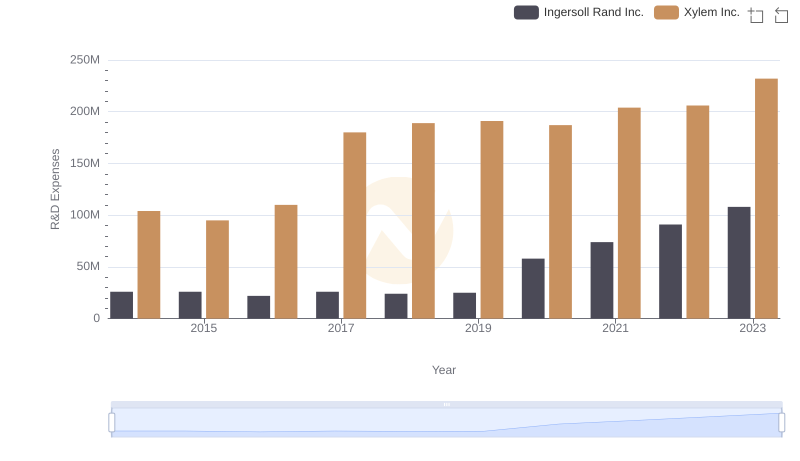
Research and Development Investment: Ingersoll Rand Inc. vs Xylem Inc.
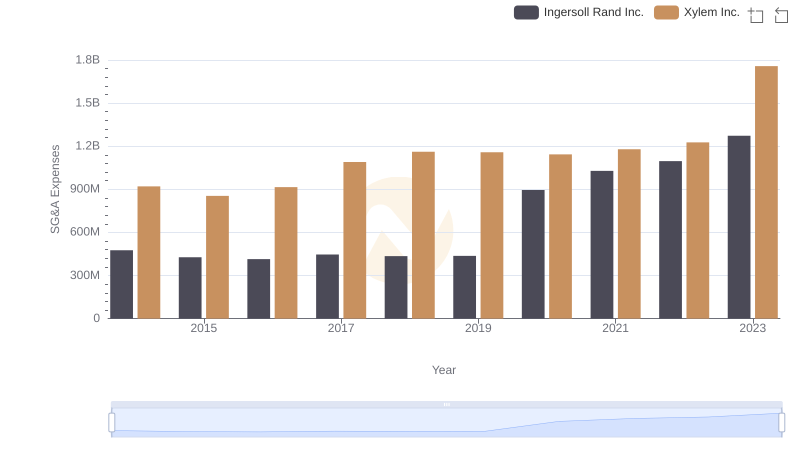
Operational Costs Compared: SG&A Analysis of Ingersoll Rand Inc. and Xylem Inc.