| __timestamp | Ferrovial SE | Ingersoll Rand Inc. |
|---|---|---|
| Wednesday, January 1, 2014 | 8802000000 | 2570005000 |
| Thursday, January 1, 2015 | 9699000000 | 2126900000 |
| Friday, January 1, 2016 | 10758000000 | 1939436000 |
| Sunday, January 1, 2017 | 12209000000 | 2375400000 |
| Monday, January 1, 2018 | 5737000000 | 2689800000 |
| Tuesday, January 1, 2019 | 6054000000 | 2451900000 |
| Wednesday, January 1, 2020 | 6341000000 | 4910200000 |
| Friday, January 1, 2021 | 6778000000 | 5152400000 |
| Saturday, January 1, 2022 | 7551000000 | 5916300000 |
| Sunday, January 1, 2023 | 8514000000 | 6876100000 |
| Monday, January 1, 2024 | 0 |
Unleashing insights
In the ever-evolving landscape of global business, revenue performance is a key indicator of a company's success. This analysis delves into the annual revenue trends of two industry giants: Ingersoll Rand Inc. and Ferrovial SE, from 2014 to 2023.
Ferrovial SE, a leader in infrastructure and mobility, consistently outperformed Ingersoll Rand Inc. in revenue, peaking in 2017 with a 22% increase from 2014. However, a notable dip occurred in 2018, with revenues dropping by nearly 53% compared to the previous year. In contrast, Ingersoll Rand Inc., a powerhouse in industrial solutions, demonstrated a steady upward trajectory, with a remarkable 168% growth from 2014 to 2023.
This comparative analysis highlights the resilience and strategic growth of Ingersoll Rand Inc., while Ferrovial SE's revenue fluctuations suggest a dynamic response to market conditions.
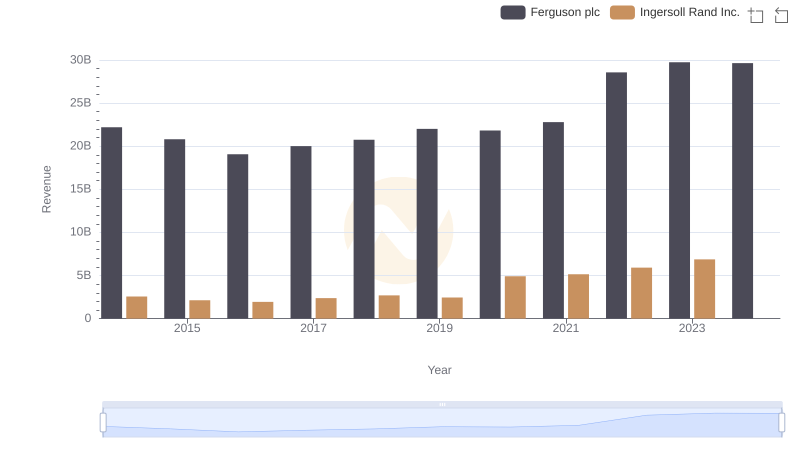
Ingersoll Rand Inc. vs Ferguson plc: Examining Key Revenue Metrics
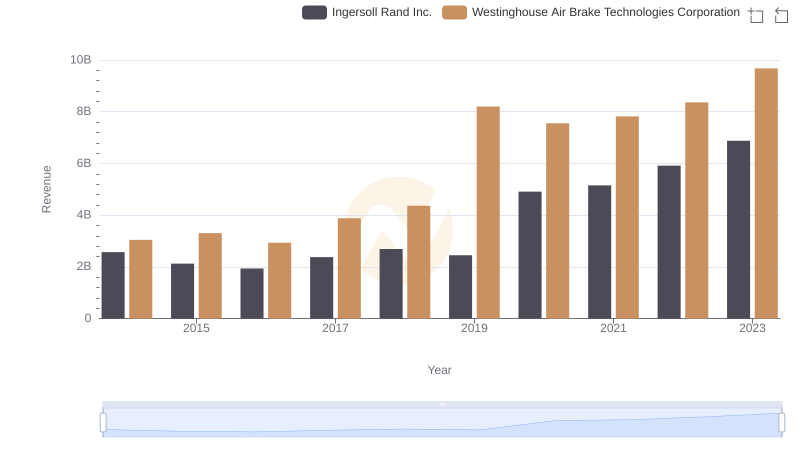
Revenue Insights: Ingersoll Rand Inc. and Westinghouse Air Brake Technologies Corporation Performance Compared
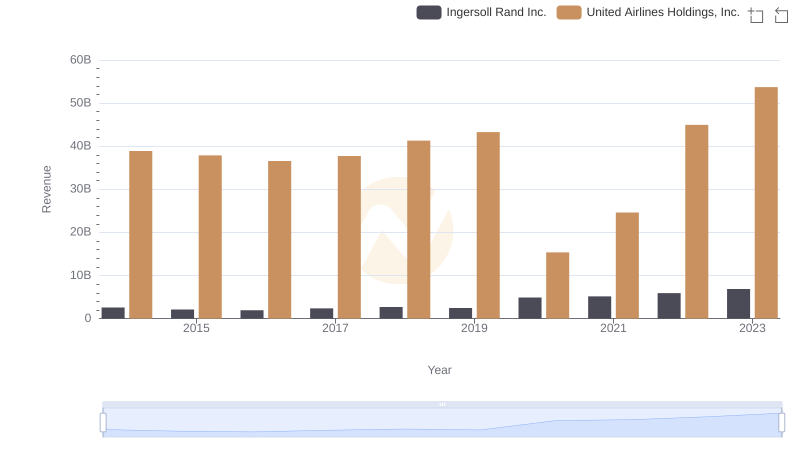
Ingersoll Rand Inc. or United Airlines Holdings, Inc.: Who Leads in Yearly Revenue?
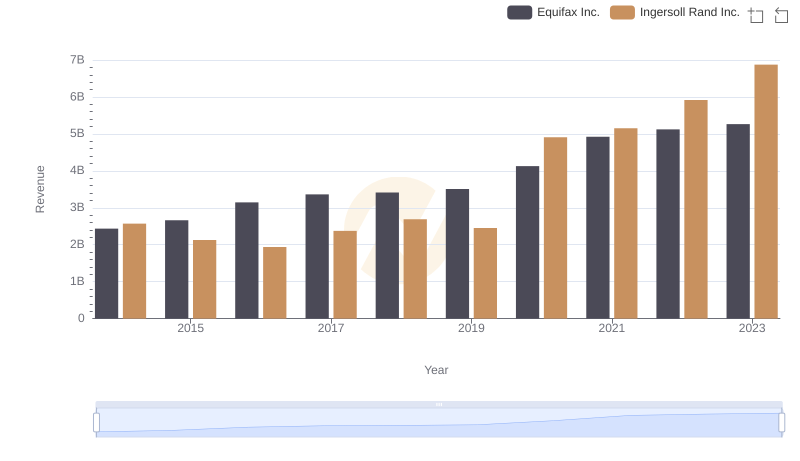
Ingersoll Rand Inc. vs Equifax Inc.: Examining Key Revenue Metrics
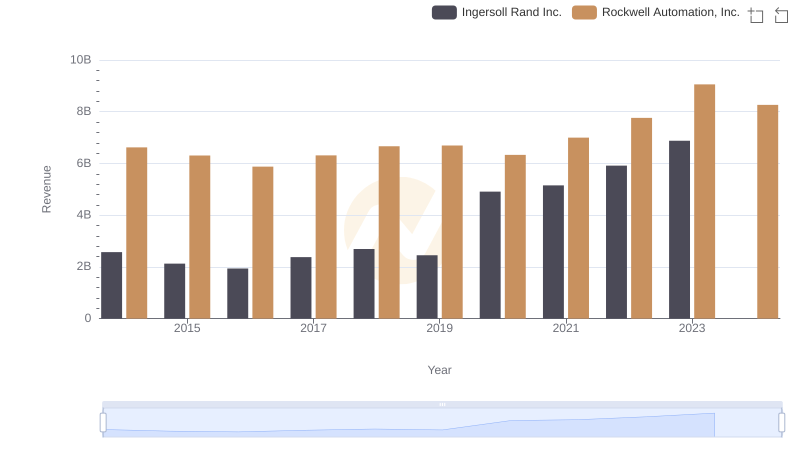
Breaking Down Revenue Trends: Ingersoll Rand Inc. vs Rockwell Automation, Inc.
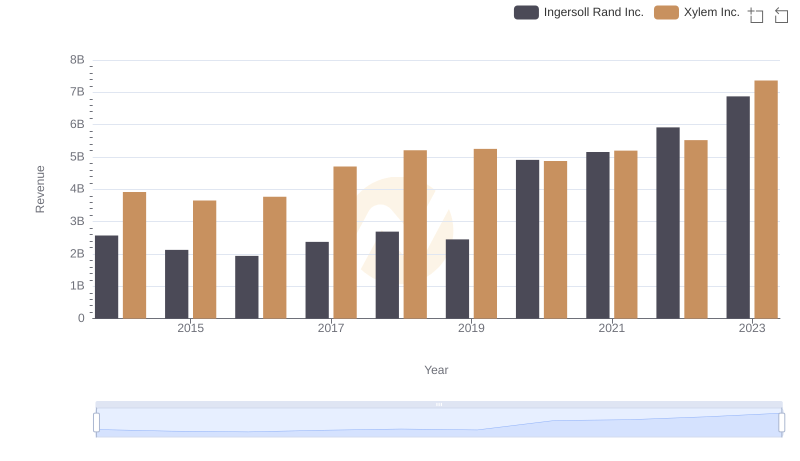
Revenue Insights: Ingersoll Rand Inc. and Xylem Inc. Performance Compared
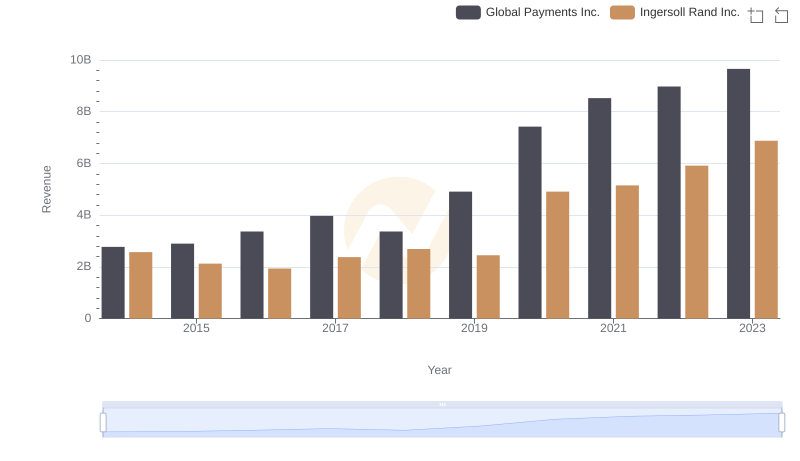
Ingersoll Rand Inc. and Global Payments Inc.: A Comprehensive Revenue Analysis
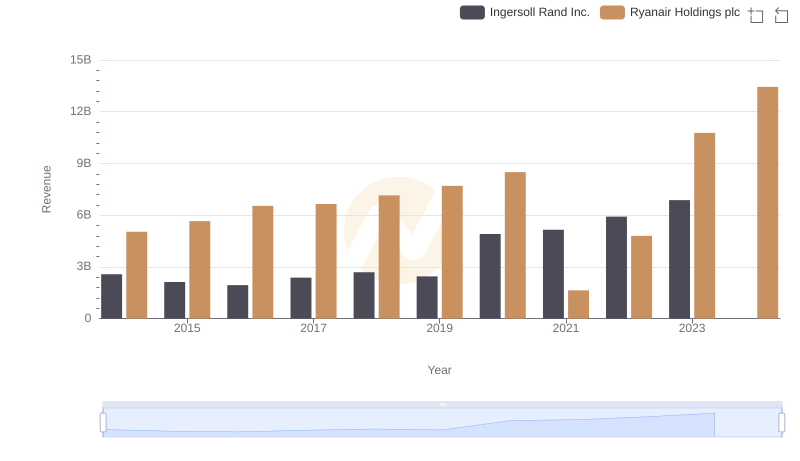
Comparing Revenue Performance: Ingersoll Rand Inc. or Ryanair Holdings plc?