| __timestamp | Global Payments Inc. | Ingersoll Rand Inc. |
|---|---|---|
| Wednesday, January 1, 2014 | 2773718000 | 2570005000 |
| Thursday, January 1, 2015 | 2898150000 | 2126900000 |
| Friday, January 1, 2016 | 3370976000 | 1939436000 |
| Sunday, January 1, 2017 | 3975163000 | 2375400000 |
| Monday, January 1, 2018 | 3366366000 | 2689800000 |
| Tuesday, January 1, 2019 | 4911892000 | 2451900000 |
| Wednesday, January 1, 2020 | 7423558000 | 4910200000 |
| Friday, January 1, 2021 | 8523762000 | 5152400000 |
| Saturday, January 1, 2022 | 8975515000 | 5916300000 |
| Sunday, January 1, 2023 | 9654419000 | 6876100000 |
| Monday, January 1, 2024 | 10105894000 | 0 |
Unlocking the unknown
In the ever-evolving landscape of industrial and financial services, Ingersoll Rand Inc. and Global Payments Inc. have demonstrated remarkable revenue trajectories over the past decade. From 2014 to 2023, Global Payments Inc. has seen its revenue soar by approximately 248%, starting from $2.77 billion and reaching an impressive $9.65 billion. This growth underscores the company's strategic expansions and adaptability in the digital payment sector.
Conversely, Ingersoll Rand Inc. has experienced a steady climb, with its revenue increasing by about 167% over the same period, from $2.57 billion to $6.88 billion. This growth reflects the company's resilience and innovation in the industrial sector, even amidst global economic challenges.
These trends highlight the dynamic nature of these industries and the companies' ability to capitalize on emerging opportunities, setting a benchmark for future growth and innovation.
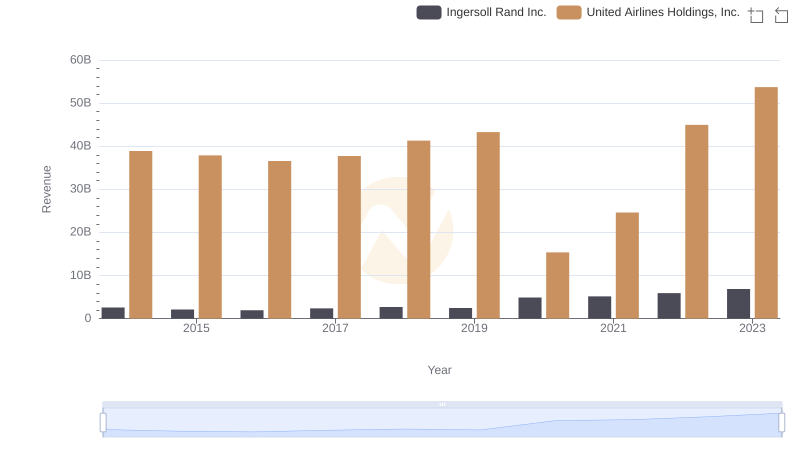
Ingersoll Rand Inc. or United Airlines Holdings, Inc.: Who Leads in Yearly Revenue?
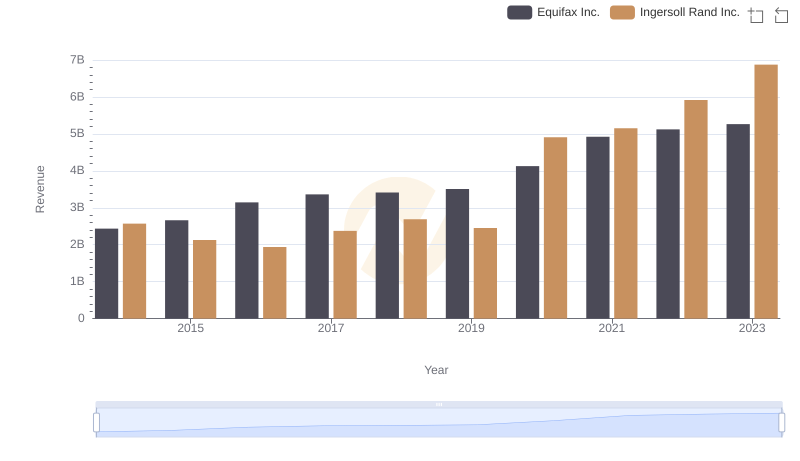
Ingersoll Rand Inc. vs Equifax Inc.: Examining Key Revenue Metrics
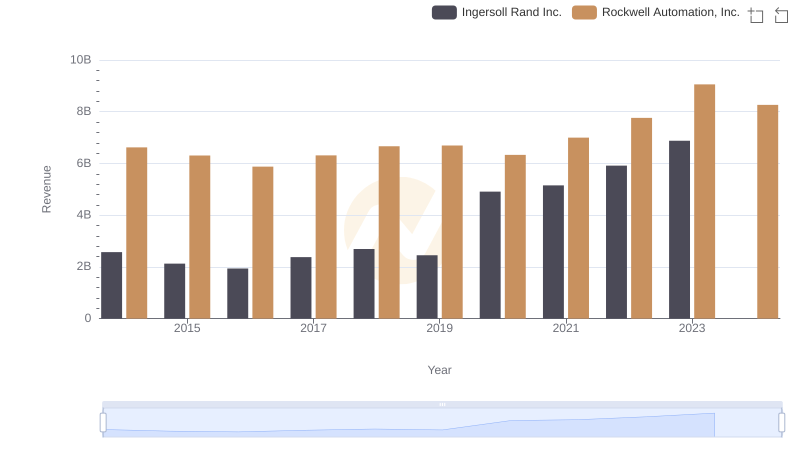
Breaking Down Revenue Trends: Ingersoll Rand Inc. vs Rockwell Automation, Inc.
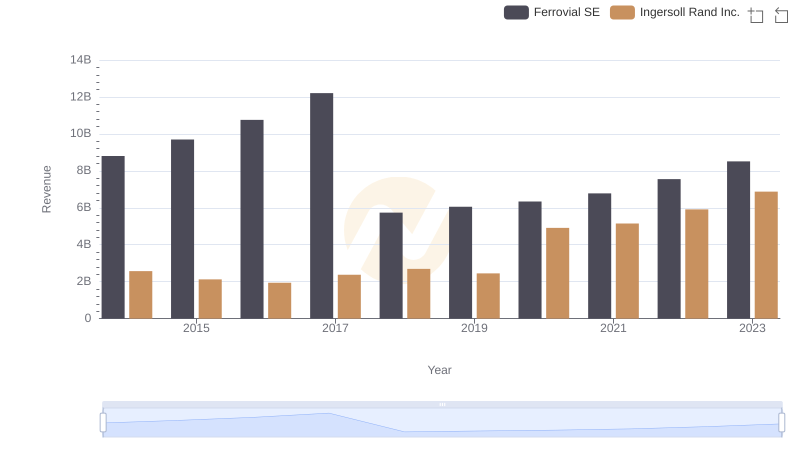
Comparing Revenue Performance: Ingersoll Rand Inc. or Ferrovial SE?
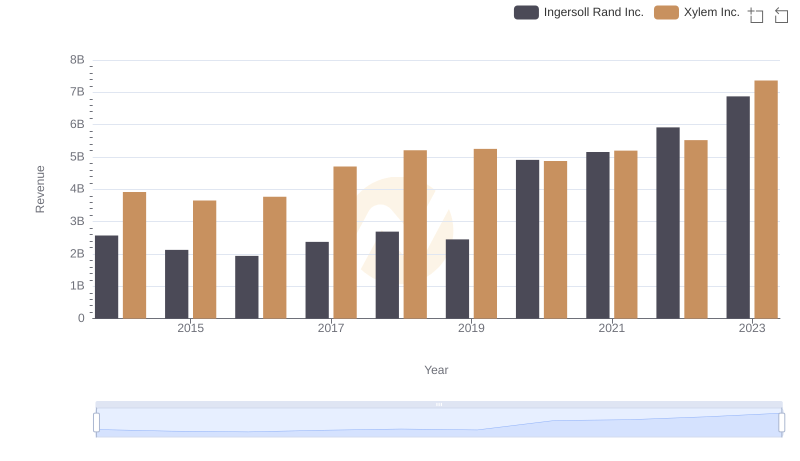
Revenue Insights: Ingersoll Rand Inc. and Xylem Inc. Performance Compared
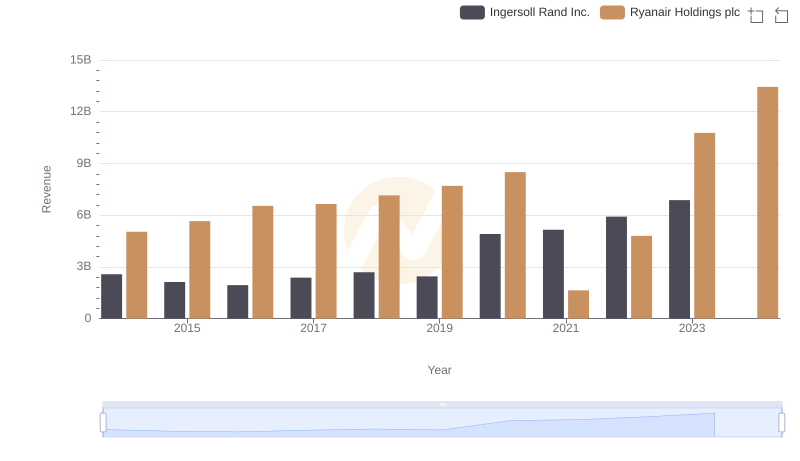
Comparing Revenue Performance: Ingersoll Rand Inc. or Ryanair Holdings plc?
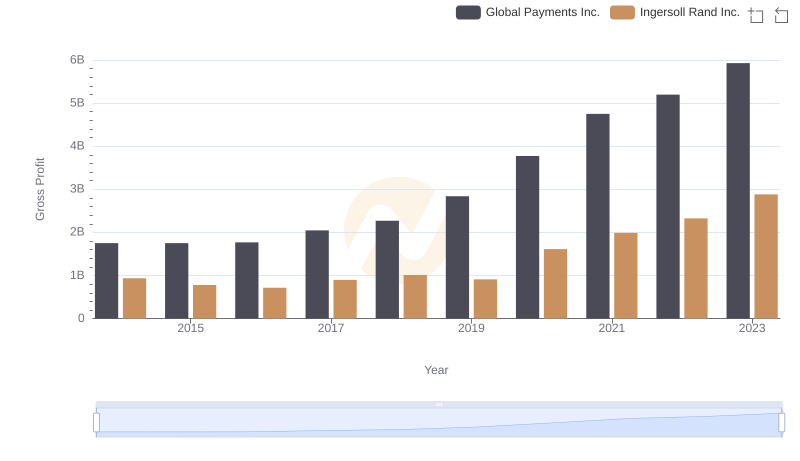
Who Generates Higher Gross Profit? Ingersoll Rand Inc. or Global Payments Inc.
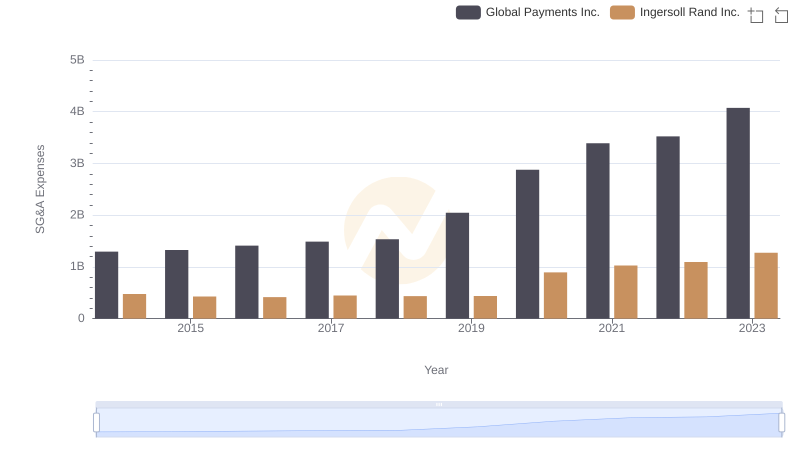
Cost Management Insights: SG&A Expenses for Ingersoll Rand Inc. and Global Payments Inc.