| __timestamp | Automatic Data Processing, Inc. | Comfort Systems USA, Inc. |
|---|---|---|
| Wednesday, January 1, 2014 | 11832800000 | 1410795000 |
| Thursday, January 1, 2015 | 10560800000 | 1580519000 |
| Friday, January 1, 2016 | 11290500000 | 1634340000 |
| Sunday, January 1, 2017 | 11982400000 | 1787922000 |
| Monday, January 1, 2018 | 12859300000 | 2182879000 |
| Tuesday, January 1, 2019 | 13613300000 | 2615277000 |
| Wednesday, January 1, 2020 | 14589800000 | 2856659000 |
| Friday, January 1, 2021 | 15005400000 | 3073636000 |
| Saturday, January 1, 2022 | 16498300000 | 4140364000 |
| Sunday, January 1, 2023 | 18012200000 | 5206760000 |
| Monday, January 1, 2024 | 19202600000 |
Unleashing the power of data
In the competitive landscape of the U.S. stock market, Automatic Data Processing, Inc. (ADP) and Comfort Systems USA, Inc. (FIX) have showcased intriguing revenue trajectories over the past decade. ADP, a leader in human resources management, has seen its revenue grow by approximately 62% from 2014 to 2023, reaching a peak of $19.2 billion in 2023. This steady climb highlights ADP's robust market position and strategic growth initiatives.
Conversely, Comfort Systems USA, a key player in the mechanical services industry, has experienced a remarkable revenue surge of around 269% during the same period, culminating in $5.2 billion in 2023. This impressive growth underscores the increasing demand for mechanical services across the nation.
While ADP's revenue data for 2024 remains unavailable, the trends observed offer valuable insights into the evolving dynamics of these industries.
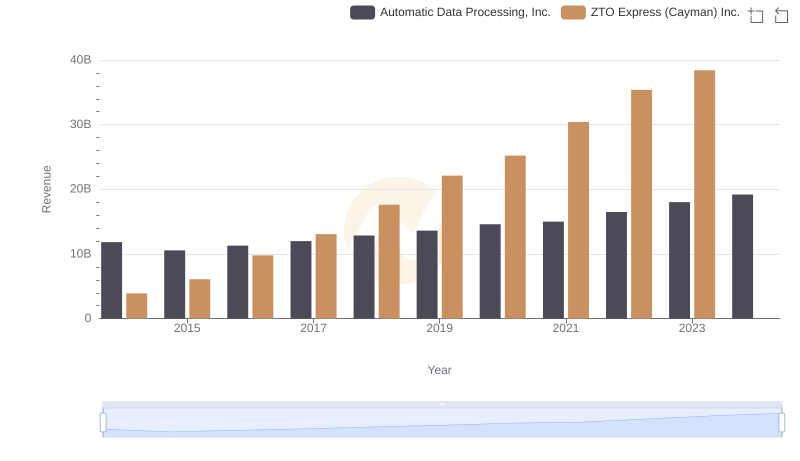
Revenue Insights: Automatic Data Processing, Inc. and ZTO Express (Cayman) Inc. Performance Compared
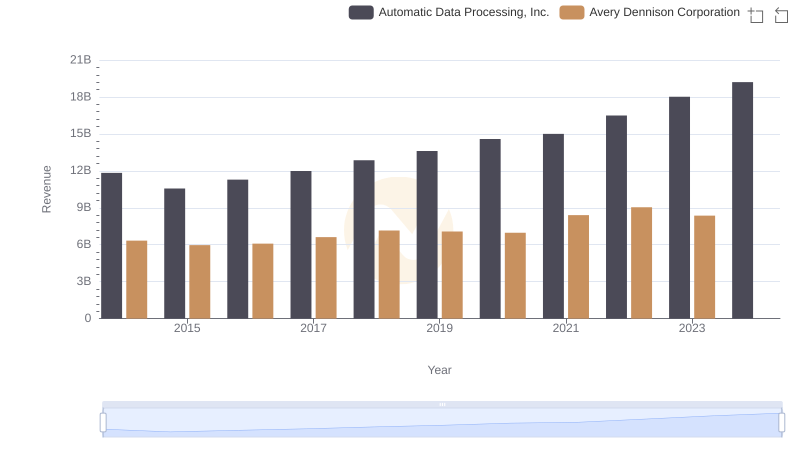
Automatic Data Processing, Inc. or Avery Dennison Corporation: Who Leads in Yearly Revenue?
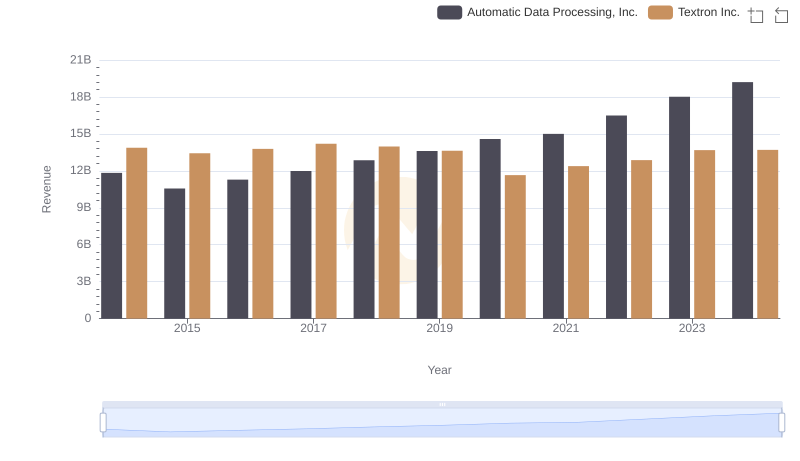
Revenue Showdown: Automatic Data Processing, Inc. vs Textron Inc.
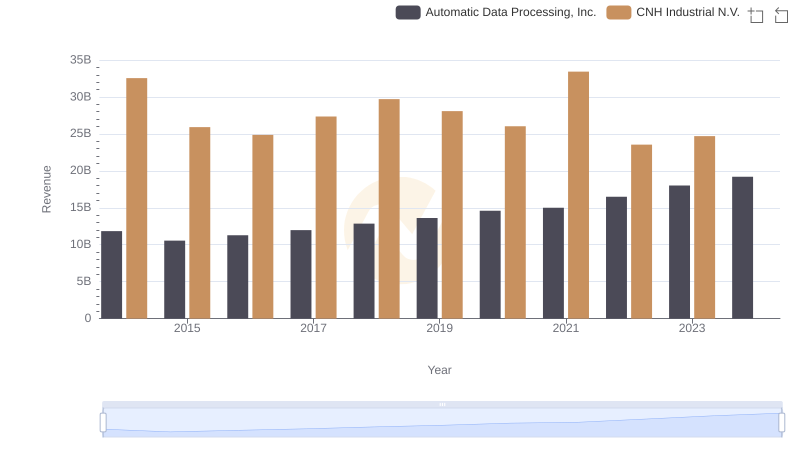
Automatic Data Processing, Inc. and CNH Industrial N.V.: A Comprehensive Revenue Analysis
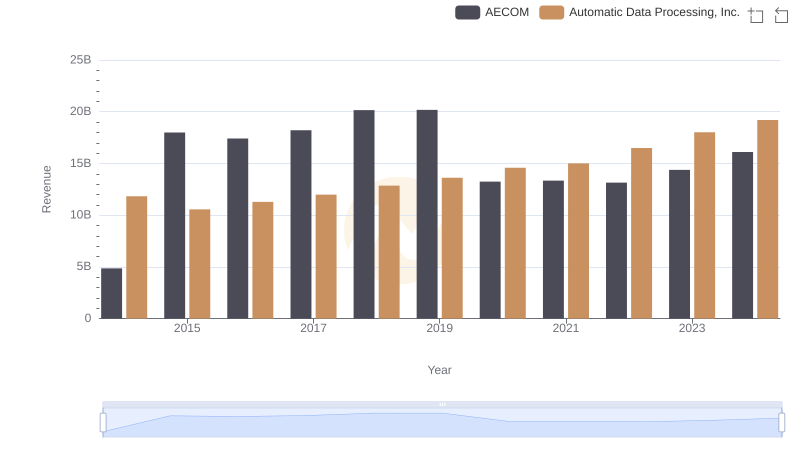
Annual Revenue Comparison: Automatic Data Processing, Inc. vs AECOM
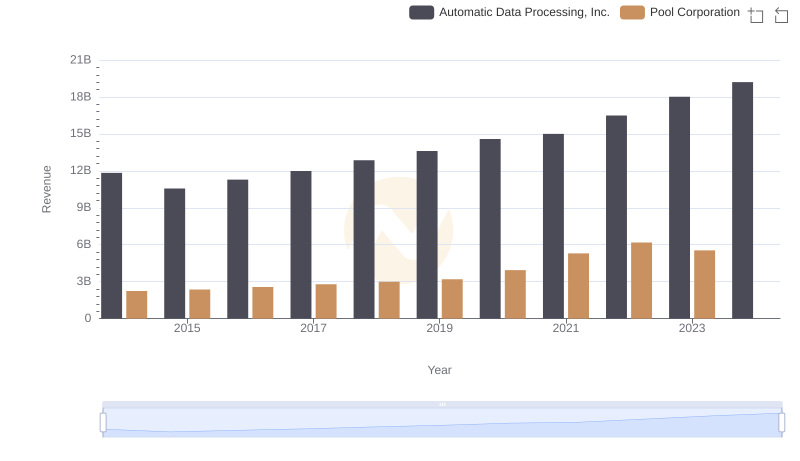
Revenue Showdown: Automatic Data Processing, Inc. vs Pool Corporation
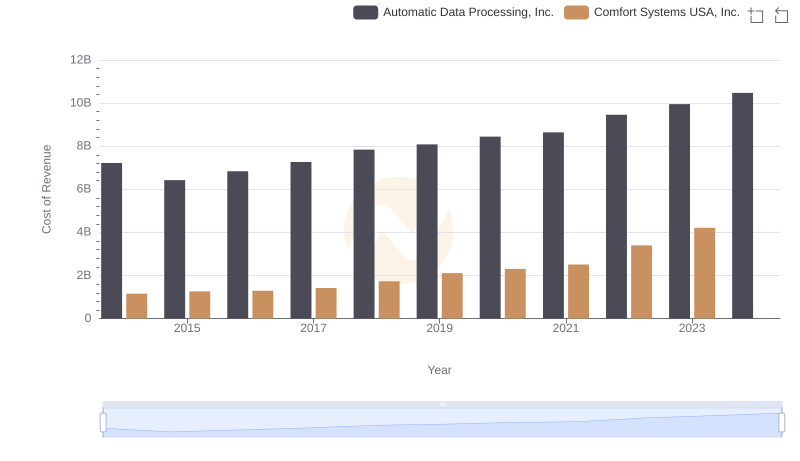
Automatic Data Processing, Inc. vs Comfort Systems USA, Inc.: Efficiency in Cost of Revenue Explored
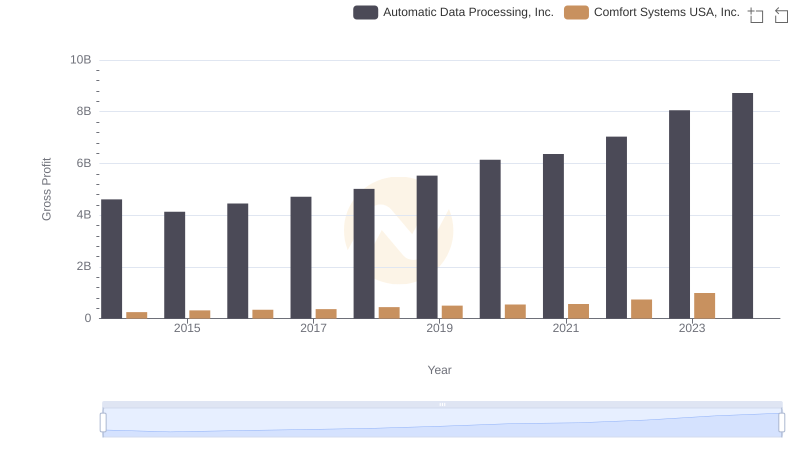
Gross Profit Comparison: Automatic Data Processing, Inc. and Comfort Systems USA, Inc. Trends
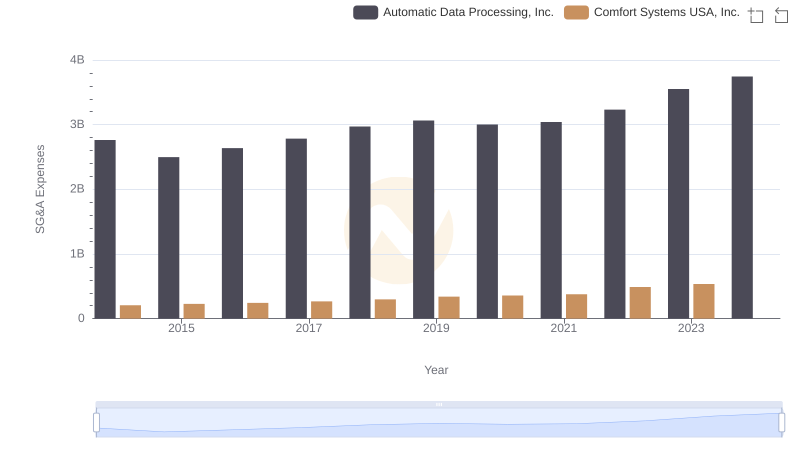
Automatic Data Processing, Inc. or Comfort Systems USA, Inc.: Who Manages SG&A Costs Better?
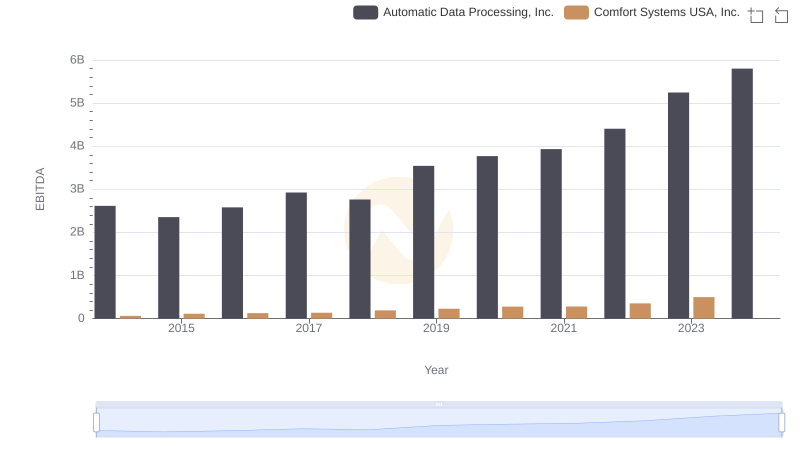
EBITDA Analysis: Evaluating Automatic Data Processing, Inc. Against Comfort Systems USA, Inc.