| __timestamp | Automatic Data Processing, Inc. | Dover Corporation |
|---|---|---|
| Wednesday, January 1, 2014 | 4611400000 | 2974249000 |
| Thursday, January 1, 2015 | 4133200000 | 2568144000 |
| Friday, January 1, 2016 | 4450200000 | 2471969000 |
| Sunday, January 1, 2017 | 4712600000 | 2890377000 |
| Monday, January 1, 2018 | 5016700000 | 2559556000 |
| Tuesday, January 1, 2019 | 5526700000 | 2620938000 |
| Wednesday, January 1, 2020 | 6144700000 | 2474019000 |
| Friday, January 1, 2021 | 6365100000 | 2969786000 |
| Saturday, January 1, 2022 | 7036400000 | 3063556000 |
| Sunday, January 1, 2023 | 8058800000 | 3084633000 |
| Monday, January 1, 2024 | 8725900000 | 2958621000 |
Data in motion
In the ever-evolving landscape of corporate finance, understanding the trajectory of gross profits is crucial. From 2014 to 2023, Automatic Data Processing, Inc. (ADP) and Dover Corporation have showcased distinct financial journeys. ADP's gross profit surged by approximately 89%, reflecting a robust growth trajectory, while Dover Corporation experienced a more modest increase of around 4% over the same period.
ADP's consistent upward trend, peaking in 2023, underscores its strategic prowess in the competitive business services sector. In contrast, Dover's relatively stable performance highlights its resilience in the industrial products market, despite economic fluctuations. Notably, data for 2024 is incomplete, leaving room for speculation on future trends.
These insights not only illuminate past performance but also set the stage for future financial strategies, offering valuable lessons for investors and industry analysts alike.
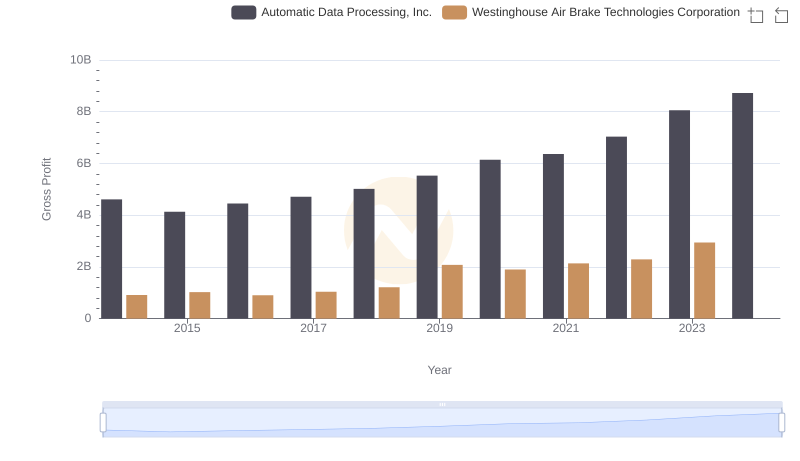
Gross Profit Comparison: Automatic Data Processing, Inc. and Westinghouse Air Brake Technologies Corporation Trends
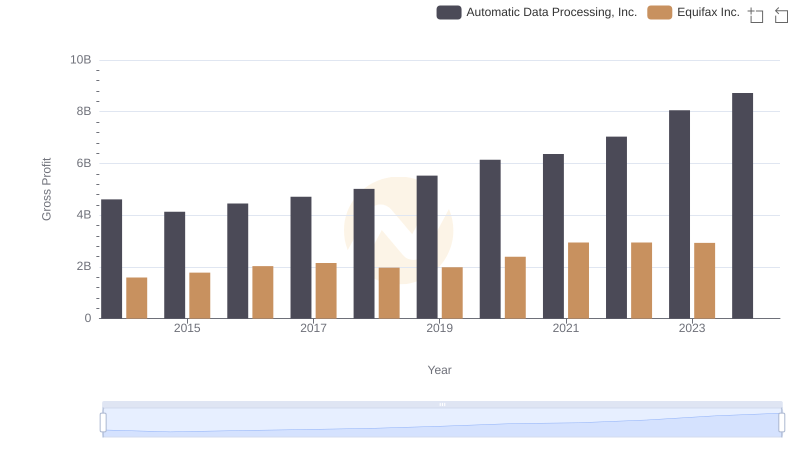
Gross Profit Trends Compared: Automatic Data Processing, Inc. vs Equifax Inc.
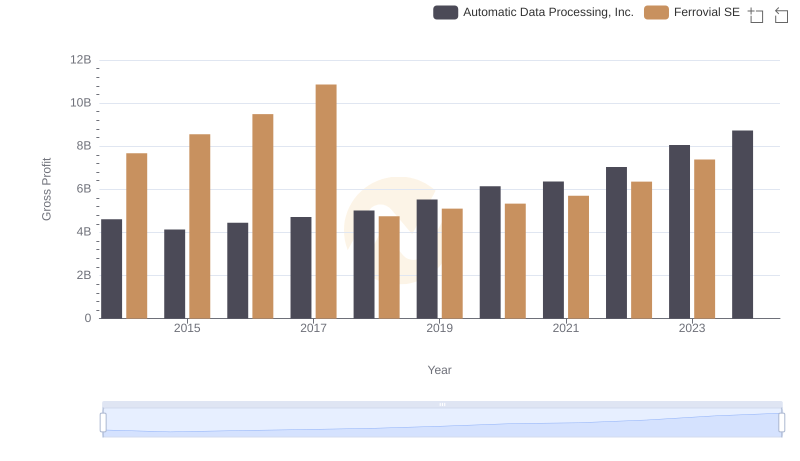
Gross Profit Comparison: Automatic Data Processing, Inc. and Ferrovial SE Trends
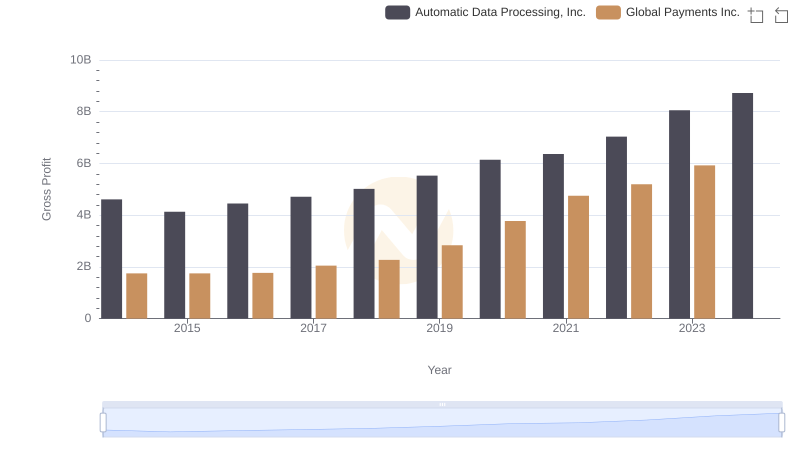
Automatic Data Processing, Inc. and Global Payments Inc.: A Detailed Gross Profit Analysis
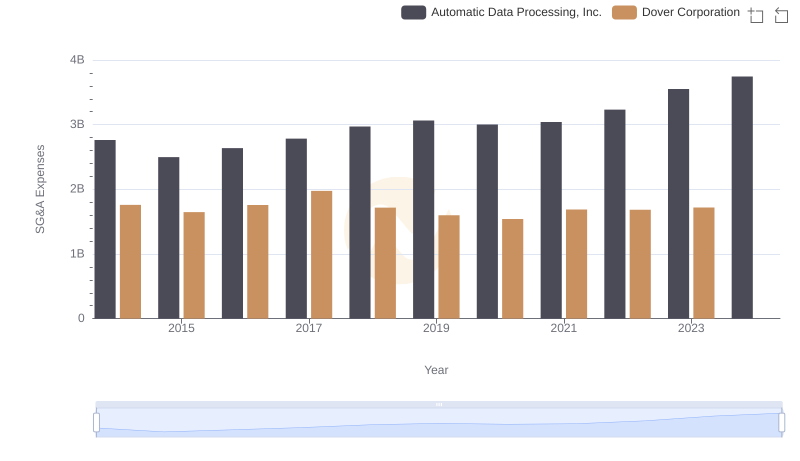
Automatic Data Processing, Inc. and Dover Corporation: SG&A Spending Patterns Compared
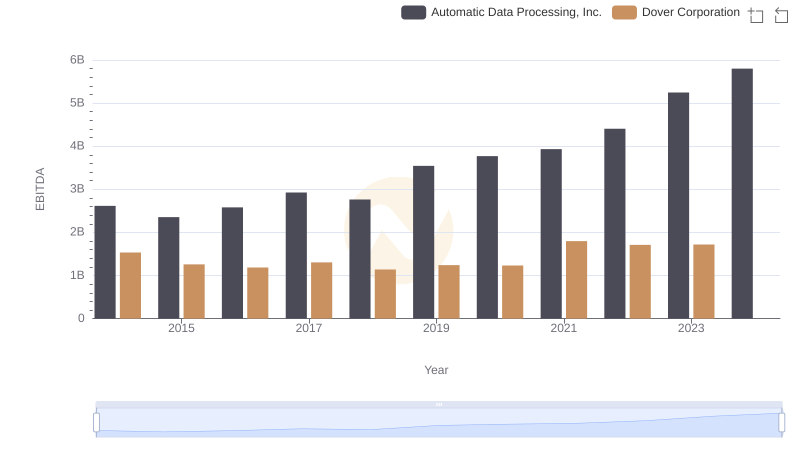
Automatic Data Processing, Inc. and Dover Corporation: A Detailed Examination of EBITDA Performance