| __timestamp | RB Global, Inc. | United Airlines Holdings, Inc. |
|---|---|---|
| Wednesday, January 1, 2014 | 481097000 | 38901000000 |
| Thursday, January 1, 2015 | 515875000 | 37864000000 |
| Friday, January 1, 2016 | 566395000 | 36556000000 |
| Sunday, January 1, 2017 | 610517000 | 37736000000 |
| Monday, January 1, 2018 | 1170026000 | 41303000000 |
| Tuesday, January 1, 2019 | 1318641000 | 43259000000 |
| Wednesday, January 1, 2020 | 1377260000 | 15355000000 |
| Friday, January 1, 2021 | 1416971000 | 24634000000 |
| Saturday, January 1, 2022 | 1733808000 | 44955000000 |
| Sunday, January 1, 2023 | 3679600000 | 53717000000 |
| Monday, January 1, 2024 | 4284200000 | 57063000000 |
Unveiling the hidden dimensions of data
In the ever-evolving landscape of the airline and global asset management industries, United Airlines Holdings, Inc. and RB Global, Inc. have showcased intriguing revenue trajectories over the past decade. From 2014 to 2023, United Airlines experienced a remarkable 38% increase in revenue, peaking in 2023. This growth underscores the airline's resilience and strategic adaptability, especially post-2020, when revenues dipped significantly due to global disruptions.
Conversely, RB Global, Inc. demonstrated a steady upward trend, with a staggering 665% revenue surge by 2023. This growth trajectory highlights the company's robust market positioning and ability to capitalize on global asset management opportunities.
These insights not only reflect the dynamic nature of these industries but also offer a glimpse into the strategic maneuvers that have propelled these companies to their current standings.
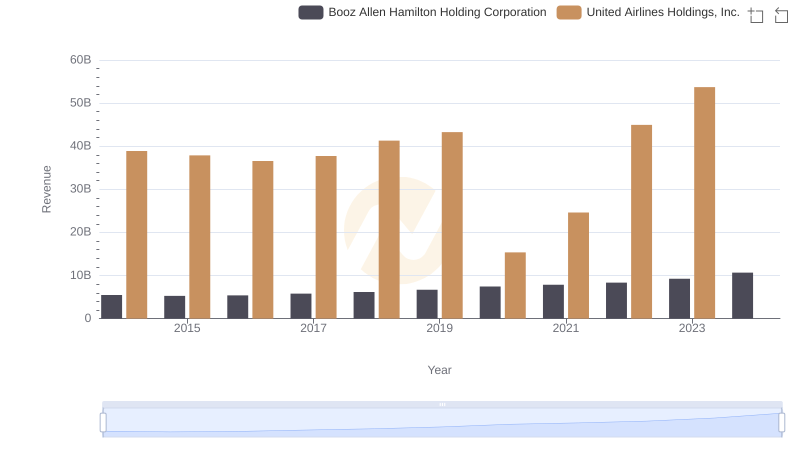
Who Generates More Revenue? United Airlines Holdings, Inc. or Booz Allen Hamilton Holding Corporation
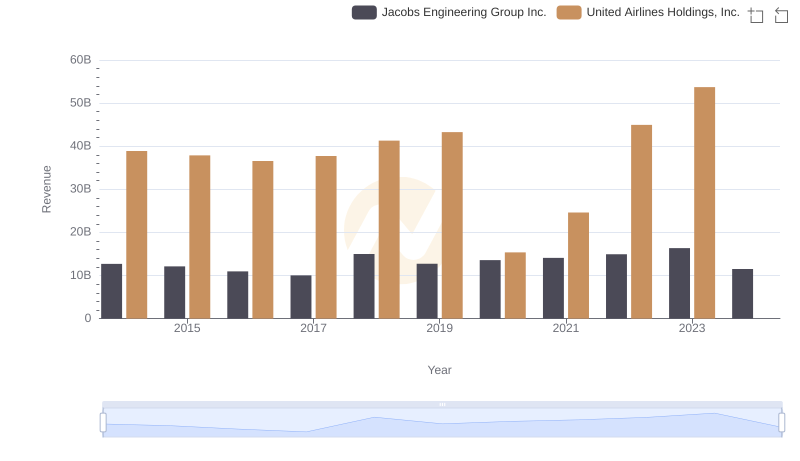
Annual Revenue Comparison: United Airlines Holdings, Inc. vs Jacobs Engineering Group Inc.
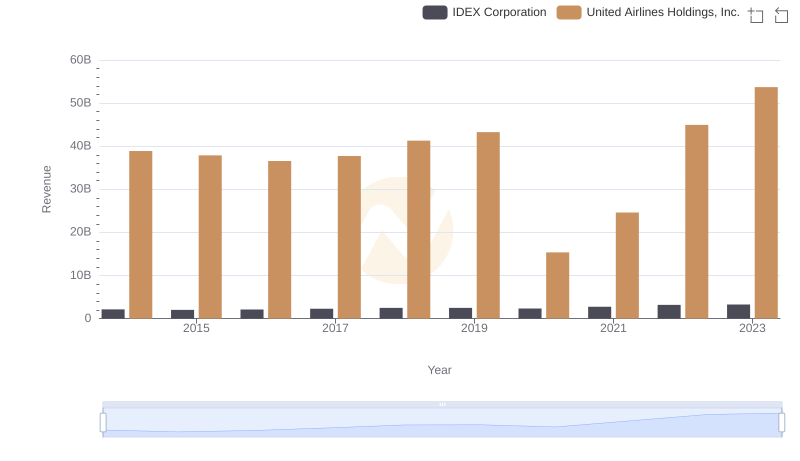
United Airlines Holdings, Inc. vs IDEX Corporation: Annual Revenue Growth Compared
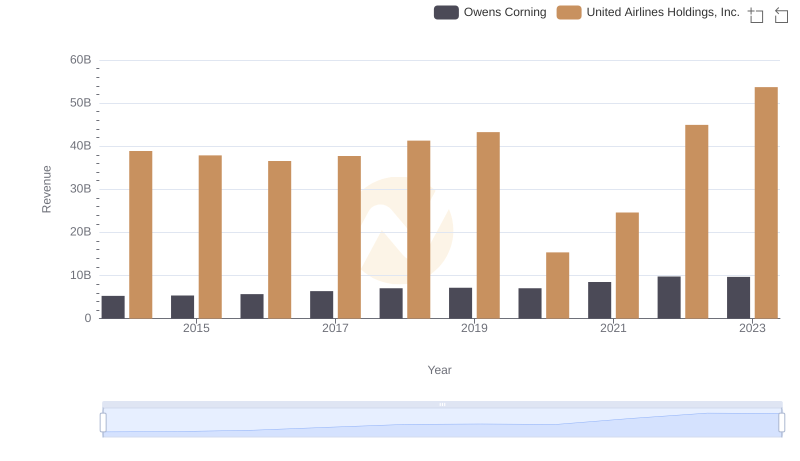
United Airlines Holdings, Inc. or Owens Corning: Who Leads in Yearly Revenue?
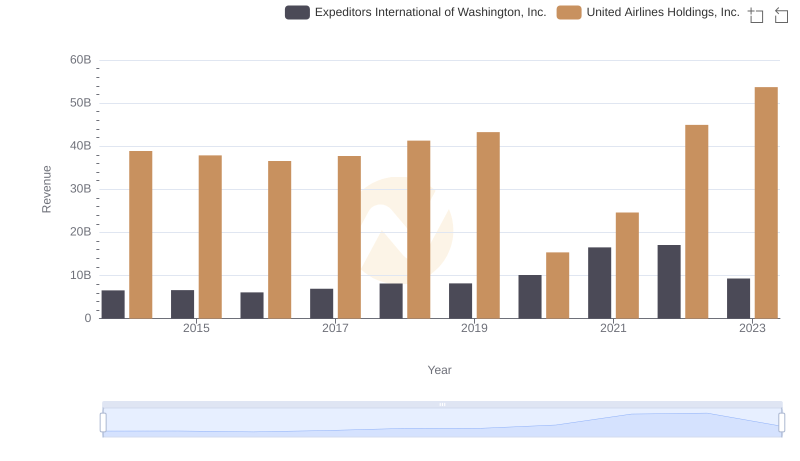
Revenue Insights: United Airlines Holdings, Inc. and Expeditors International of Washington, Inc. Performance Compared
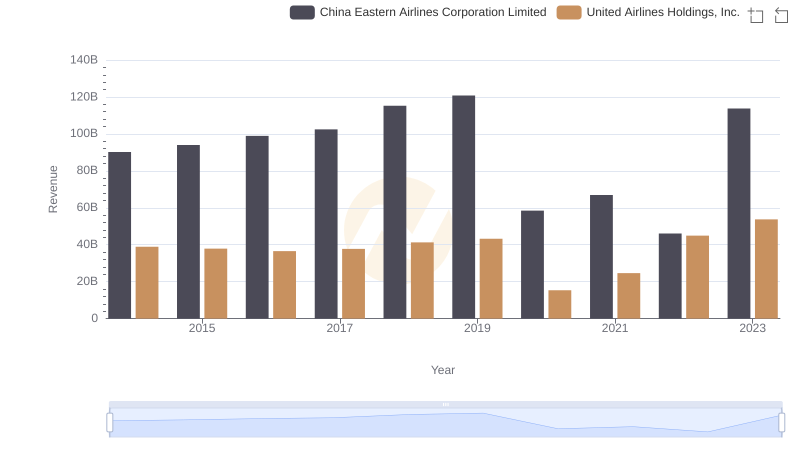
Comparing Revenue Performance: United Airlines Holdings, Inc. or China Eastern Airlines Corporation Limited?
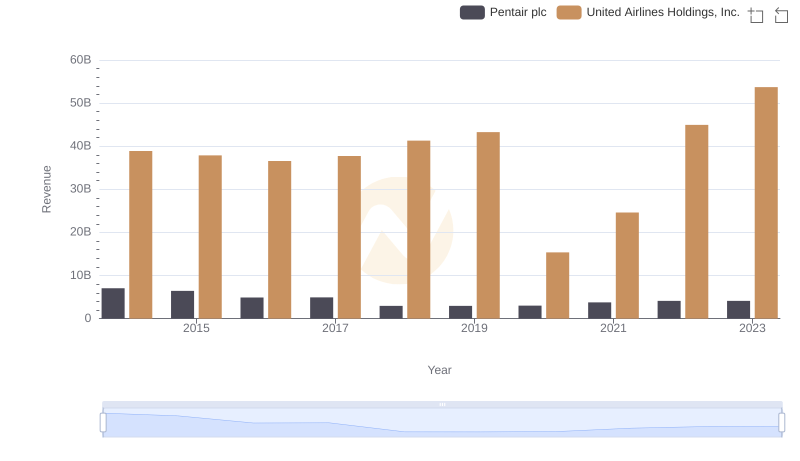
Revenue Insights: United Airlines Holdings, Inc. and Pentair plc Performance Compared
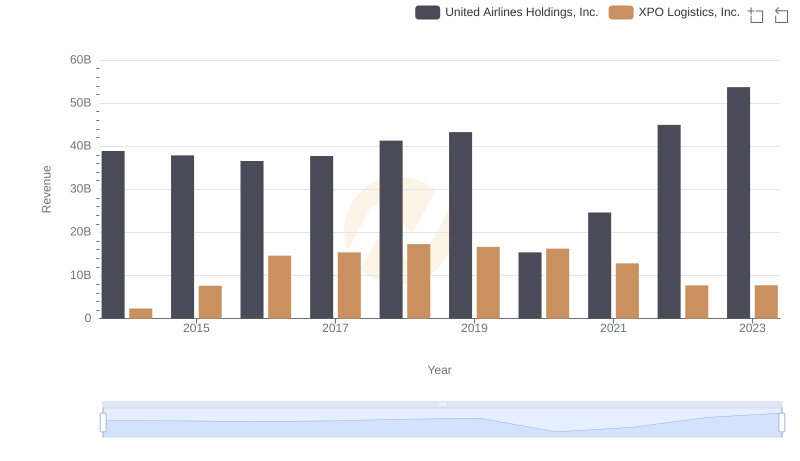
Comparing Revenue Performance: United Airlines Holdings, Inc. or XPO Logistics, Inc.?
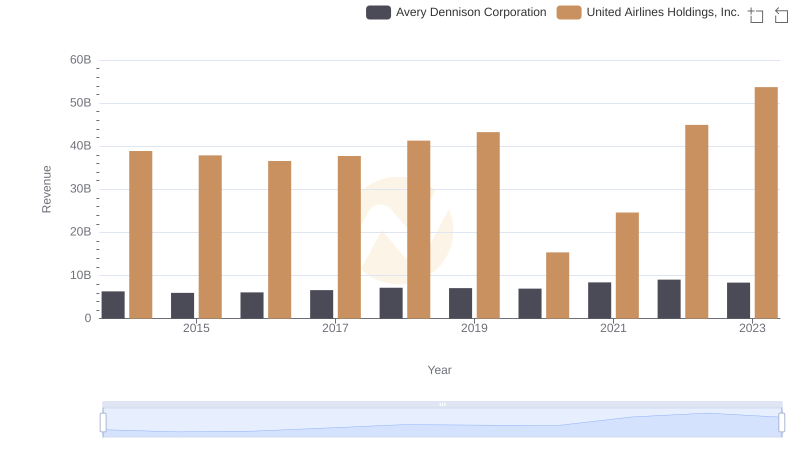
United Airlines Holdings, Inc. vs Avery Dennison Corporation: Examining Key Revenue Metrics
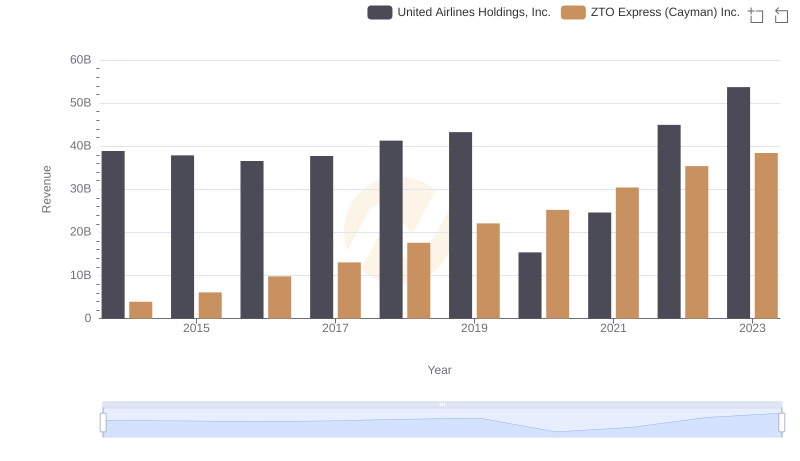
Revenue Showdown: United Airlines Holdings, Inc. vs ZTO Express (Cayman) Inc.
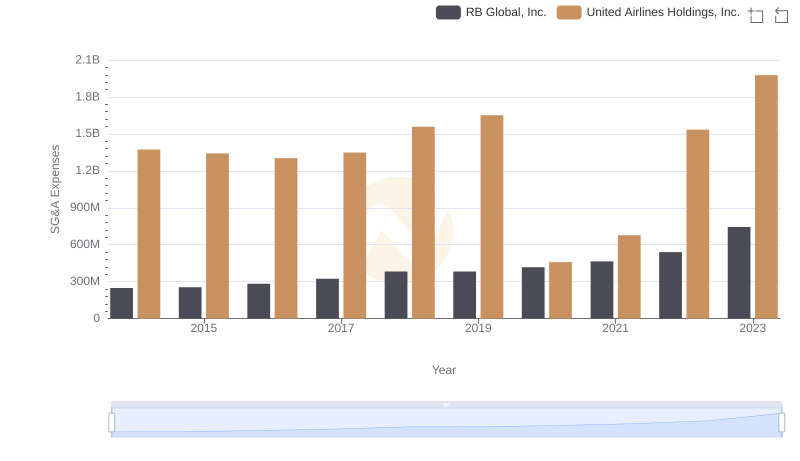
United Airlines Holdings, Inc. vs RB Global, Inc.: SG&A Expense Trends