| __timestamp | Masco Corporation | United Airlines Holdings, Inc. |
|---|---|---|
| Wednesday, January 1, 2014 | 8521000000 | 38901000000 |
| Thursday, January 1, 2015 | 7142000000 | 37864000000 |
| Friday, January 1, 2016 | 7357000000 | 36556000000 |
| Sunday, January 1, 2017 | 7644000000 | 37736000000 |
| Monday, January 1, 2018 | 8359000000 | 41303000000 |
| Tuesday, January 1, 2019 | 6707000000 | 43259000000 |
| Wednesday, January 1, 2020 | 7188000000 | 15355000000 |
| Friday, January 1, 2021 | 8375000000 | 24634000000 |
| Saturday, January 1, 2022 | 8680000000 | 44955000000 |
| Sunday, January 1, 2023 | 7967000000 | 53717000000 |
| Monday, January 1, 2024 | 7828000000 | 57063000000 |
Cracking the code
In the ever-evolving landscape of American business, United Airlines Holdings, Inc. and Masco Corporation stand as titans in their respective industries. From 2014 to 2023, these companies have navigated economic shifts, with United Airlines experiencing a remarkable revenue growth of approximately 38%, despite the pandemic-induced dip in 2020. In contrast, Masco Corporation's revenue remained relatively stable, with a slight decline of around 7% over the same period.
United Airlines' revenue trajectory highlights its resilience, bouncing back from a 60% drop in 2020 to reach new heights by 2023. Meanwhile, Masco's steady performance underscores its role as a stalwart in the home improvement sector. This comparison not only showcases the dynamic nature of the airline industry but also the steady demand for home improvement products, offering valuable insights for investors and industry enthusiasts alike.
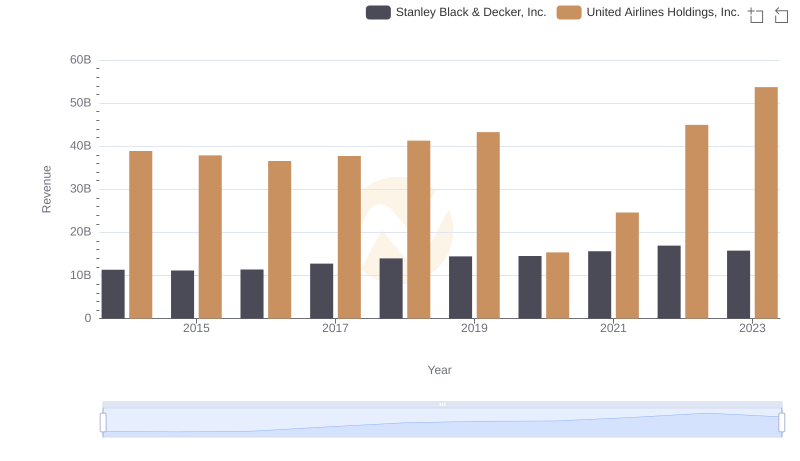
Breaking Down Revenue Trends: United Airlines Holdings, Inc. vs Stanley Black & Decker, Inc.
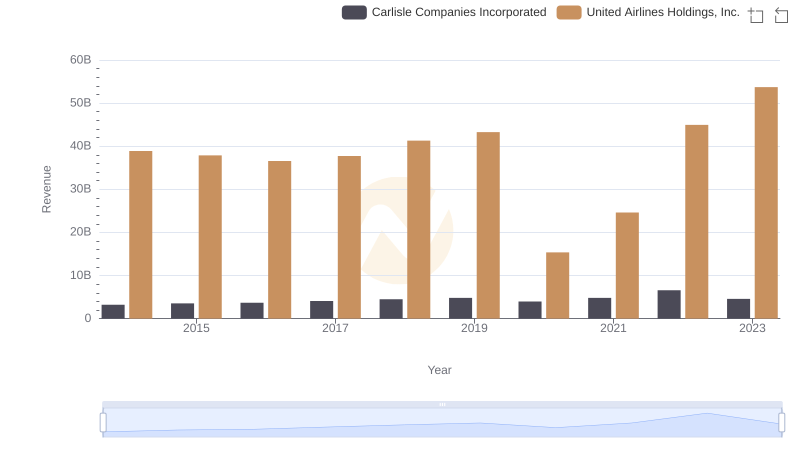
United Airlines Holdings, Inc. or Carlisle Companies Incorporated: Who Leads in Yearly Revenue?
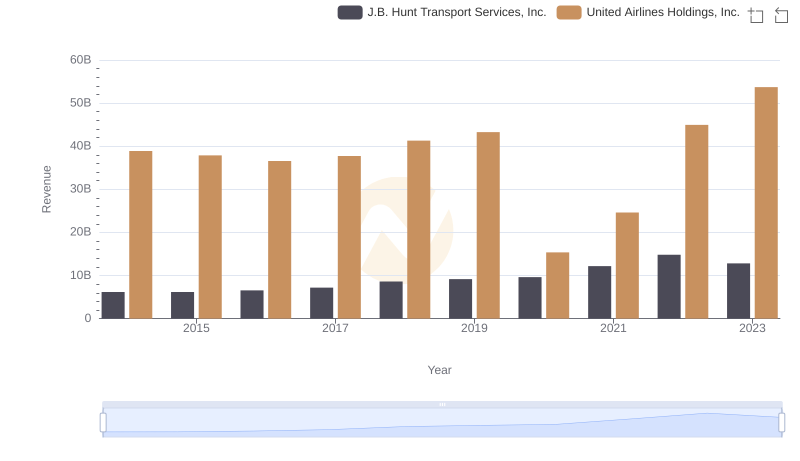
Annual Revenue Comparison: United Airlines Holdings, Inc. vs J.B. Hunt Transport Services, Inc.
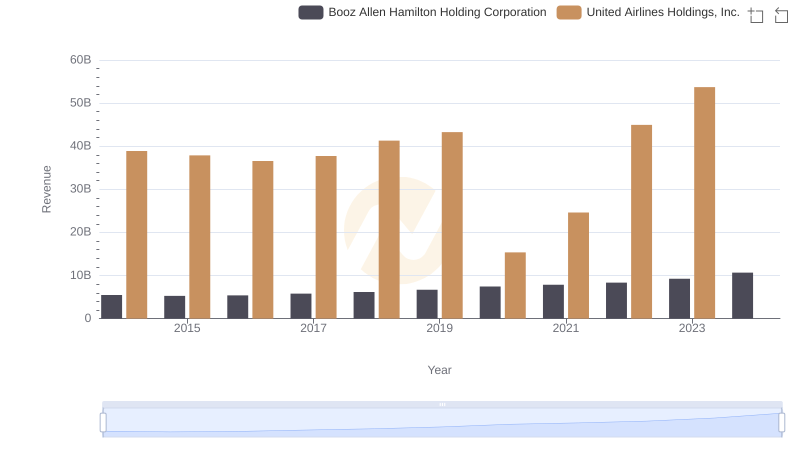
Who Generates More Revenue? United Airlines Holdings, Inc. or Booz Allen Hamilton Holding Corporation
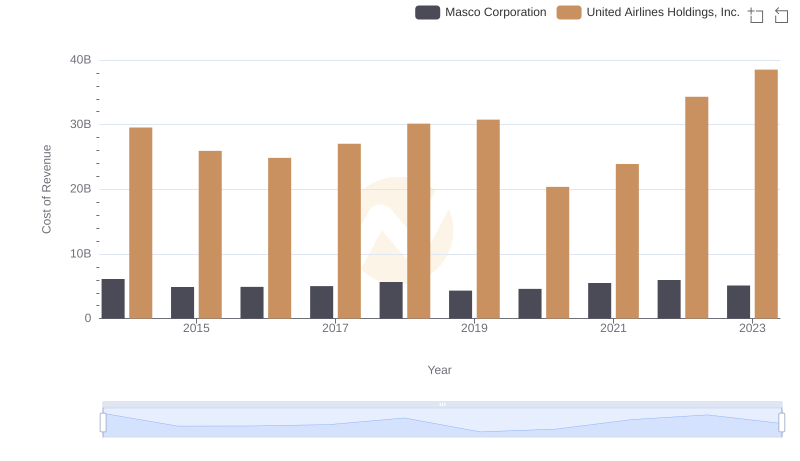
Cost of Revenue Trends: United Airlines Holdings, Inc. vs Masco Corporation
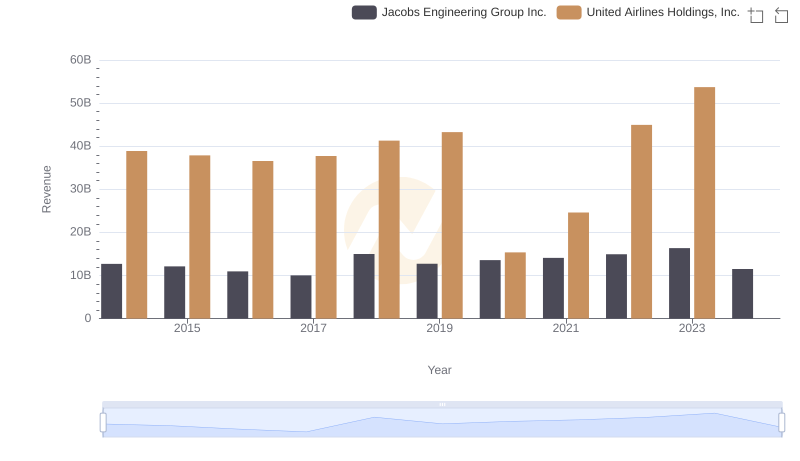
Annual Revenue Comparison: United Airlines Holdings, Inc. vs Jacobs Engineering Group Inc.
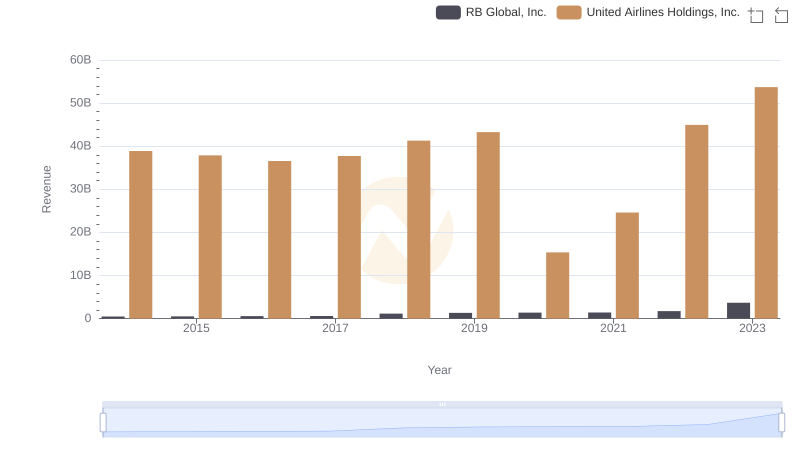
Revenue Insights: United Airlines Holdings, Inc. and RB Global, Inc. Performance Compared
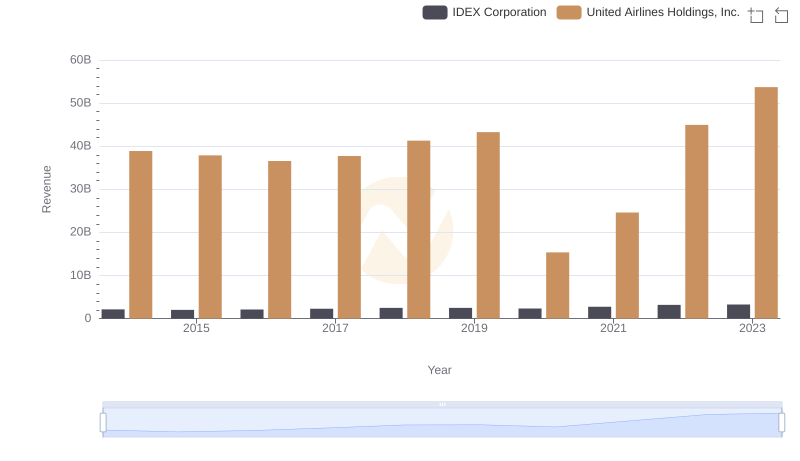
United Airlines Holdings, Inc. vs IDEX Corporation: Annual Revenue Growth Compared
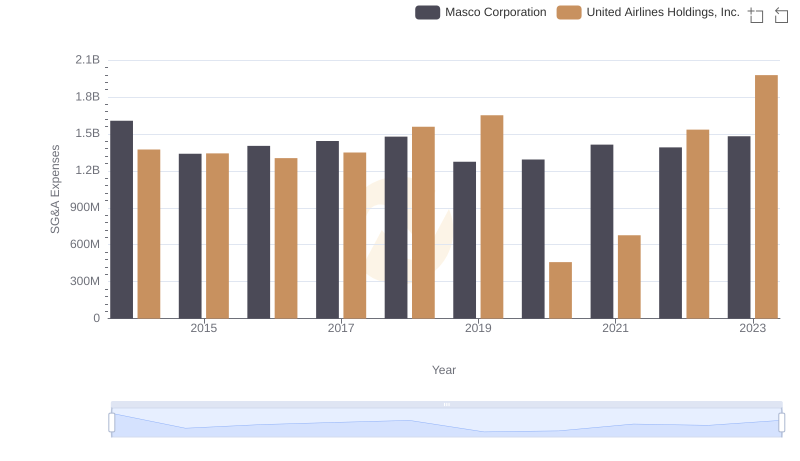
United Airlines Holdings, Inc. or Masco Corporation: Who Manages SG&A Costs Better?