| __timestamp | Jacobs Engineering Group Inc. | United Airlines Holdings, Inc. |
|---|---|---|
| Wednesday, January 1, 2014 | 12695157000 | 38901000000 |
| Thursday, January 1, 2015 | 12114832000 | 37864000000 |
| Friday, January 1, 2016 | 10964157000 | 36556000000 |
| Sunday, January 1, 2017 | 10022788000 | 37736000000 |
| Monday, January 1, 2018 | 14984646000 | 41303000000 |
| Tuesday, January 1, 2019 | 12737868000 | 43259000000 |
| Wednesday, January 1, 2020 | 13566975000 | 15355000000 |
| Friday, January 1, 2021 | 14092632000 | 24634000000 |
| Saturday, January 1, 2022 | 14922825000 | 44955000000 |
| Sunday, January 1, 2023 | 16352414000 | 53717000000 |
| Monday, January 1, 2024 | 11500941000 | 57063000000 |
Data in motion
In the ever-evolving landscape of American industry, United Airlines Holdings, Inc. and Jacobs Engineering Group Inc. stand as titans in their respective fields. Over the past decade, these companies have showcased contrasting revenue trajectories, reflecting broader economic trends and sector-specific challenges.
From 2014 to 2023, United Airlines experienced a revenue rollercoaster, peaking in 2023 with a staggering 54% increase from its 2014 figures. This growth underscores the airline's resilience and adaptability, especially in the face of the 2020 downturn, where revenues plummeted by over 60% due to global disruptions.
Conversely, Jacobs Engineering displayed a more stable revenue pattern, with a notable 29% increase from 2014 to 2023. This steady growth highlights the company's robust position in the engineering sector, even as it faced challenges in 2024, with data yet to be fully reported.
These insights offer a fascinating glimpse into the dynamics of two industry leaders, each navigating their unique paths to success.
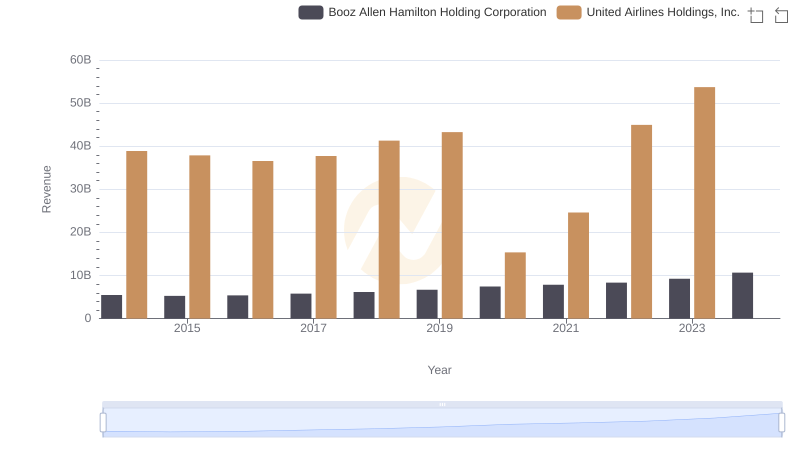
Who Generates More Revenue? United Airlines Holdings, Inc. or Booz Allen Hamilton Holding Corporation
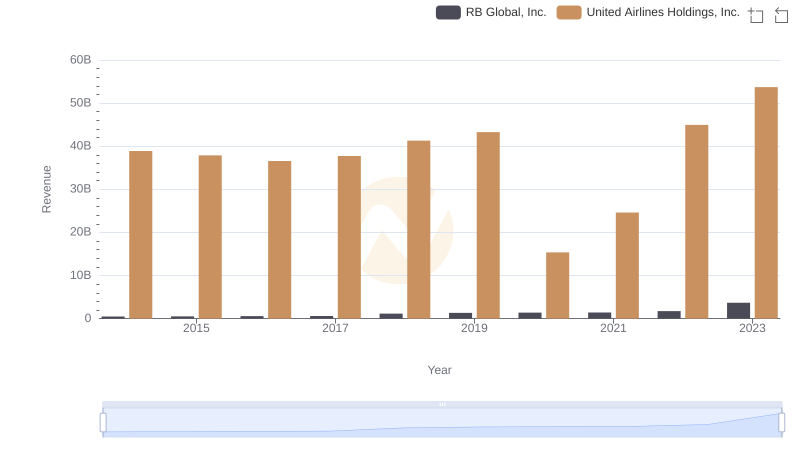
Revenue Insights: United Airlines Holdings, Inc. and RB Global, Inc. Performance Compared
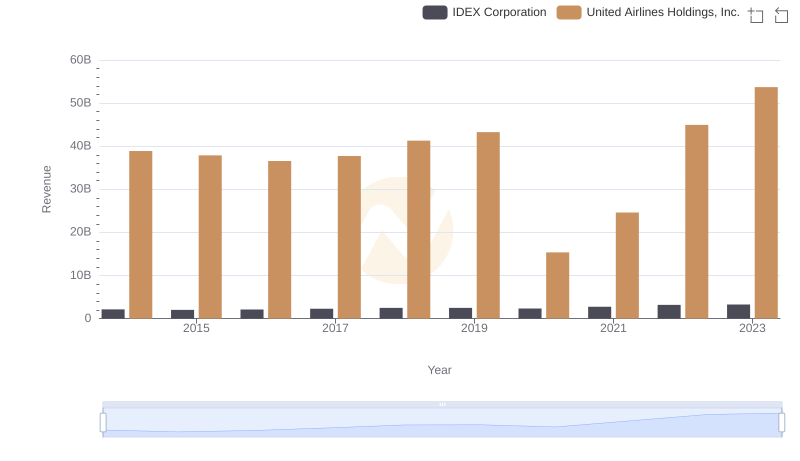
United Airlines Holdings, Inc. vs IDEX Corporation: Annual Revenue Growth Compared
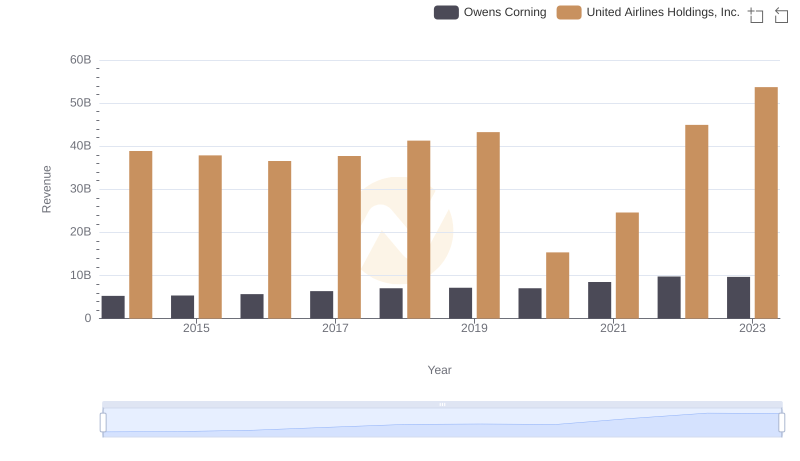
United Airlines Holdings, Inc. or Owens Corning: Who Leads in Yearly Revenue?
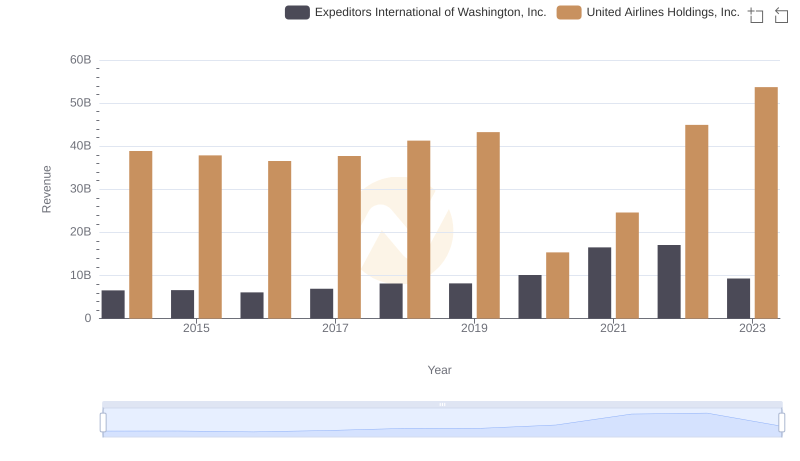
Revenue Insights: United Airlines Holdings, Inc. and Expeditors International of Washington, Inc. Performance Compared
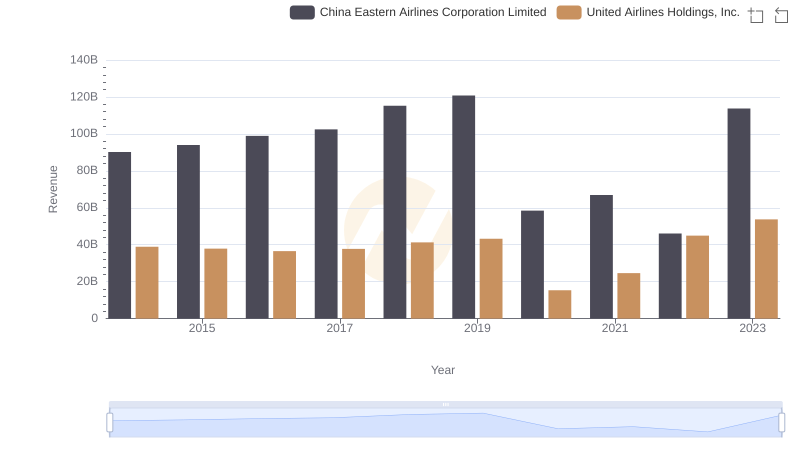
Comparing Revenue Performance: United Airlines Holdings, Inc. or China Eastern Airlines Corporation Limited?
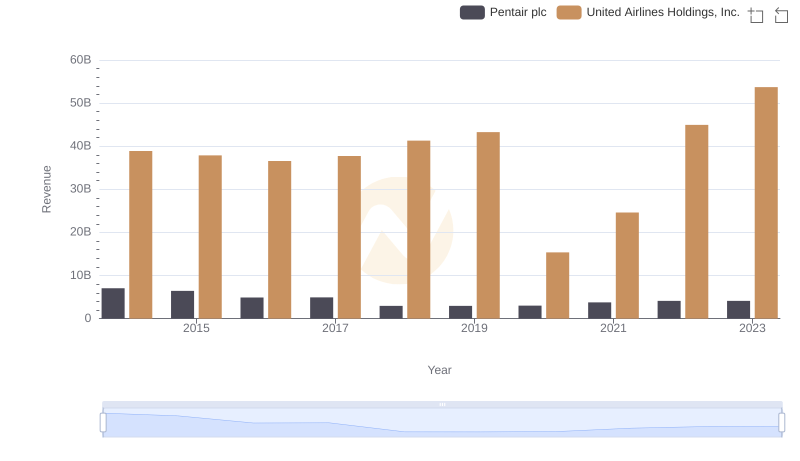
Revenue Insights: United Airlines Holdings, Inc. and Pentair plc Performance Compared
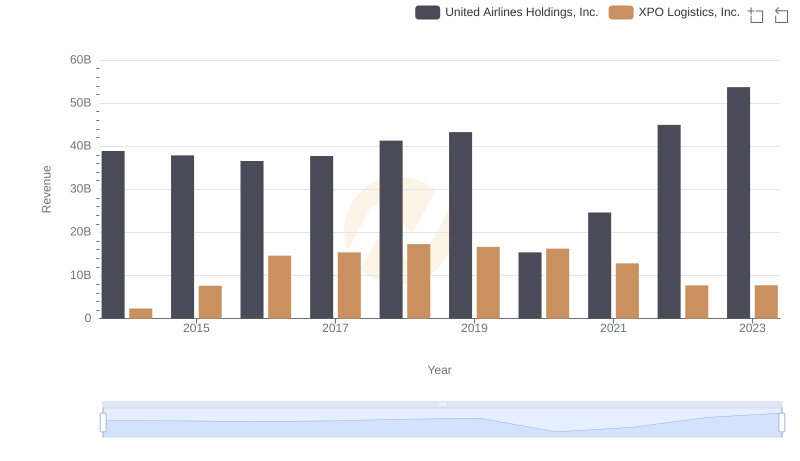
Comparing Revenue Performance: United Airlines Holdings, Inc. or XPO Logistics, Inc.?
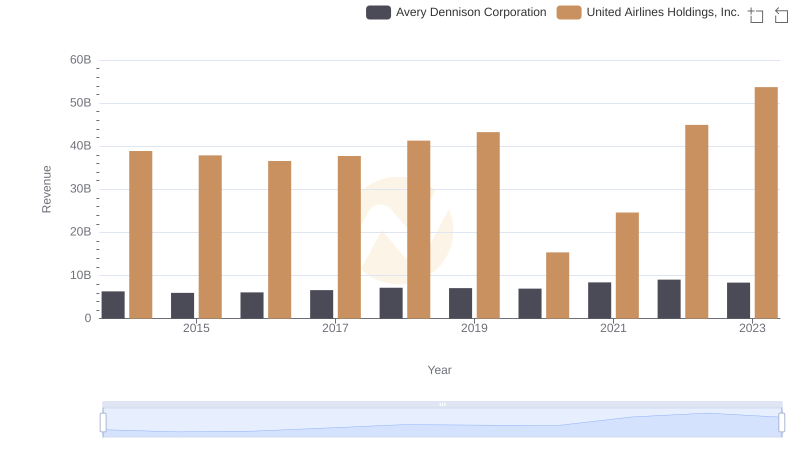
United Airlines Holdings, Inc. vs Avery Dennison Corporation: Examining Key Revenue Metrics
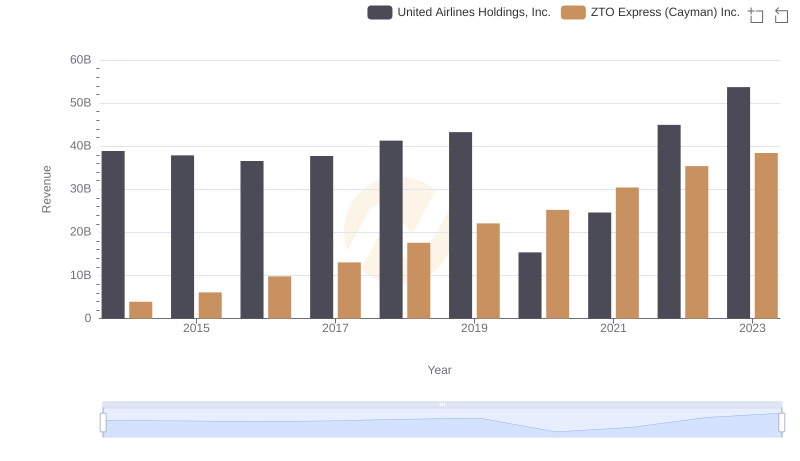
Revenue Showdown: United Airlines Holdings, Inc. vs ZTO Express (Cayman) Inc.