| __timestamp | International Business Machines Corporation | Jabil Inc. |
|---|---|---|
| Wednesday, January 1, 2014 | 92793000000 | 15762146000 |
| Thursday, January 1, 2015 | 81742000000 | 17899196000 |
| Friday, January 1, 2016 | 79920000000 | 18353086000 |
| Sunday, January 1, 2017 | 79139000000 | 19063121000 |
| Monday, January 1, 2018 | 79591000000 | 22095416000 |
| Tuesday, January 1, 2019 | 57714000000 | 25282320000 |
| Wednesday, January 1, 2020 | 55179000000 | 27266438000 |
| Friday, January 1, 2021 | 57351000000 | 29285000000 |
| Saturday, January 1, 2022 | 60530000000 | 33478000000 |
| Sunday, January 1, 2023 | 61860000000 | 34702000000 |
| Monday, January 1, 2024 | 62753000000 | 28883000000 |
Infusing magic into the data realm
In the ever-evolving landscape of technology and manufacturing, International Business Machines Corporation (IBM) and Jabil Inc. have showcased intriguing revenue trajectories over the past decade. From 2014 to 2024, IBM's revenue has seen a notable decline of approximately 32%, dropping from its peak in 2014. This trend reflects the company's strategic shift towards cloud computing and AI, moving away from traditional hardware.
Conversely, Jabil Inc., a leader in manufacturing solutions, has experienced a robust revenue growth of around 83% during the same period. This surge underscores Jabil's successful expansion into diverse sectors, including healthcare and automotive.
By 2023, Jabil's revenue reached nearly 55% of IBM's, a significant leap from 2014 when it was just 17%. This data highlights the shifting paradigms in the tech and manufacturing sectors, offering a glimpse into the future of these industries.
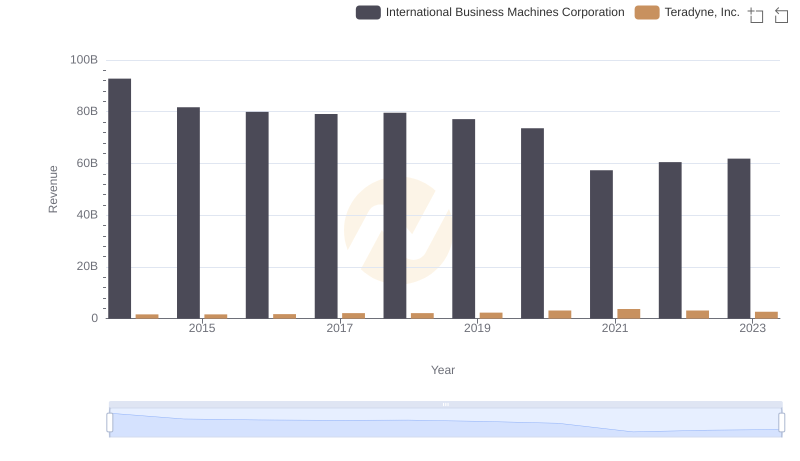
Annual Revenue Comparison: International Business Machines Corporation vs Teradyne, Inc.
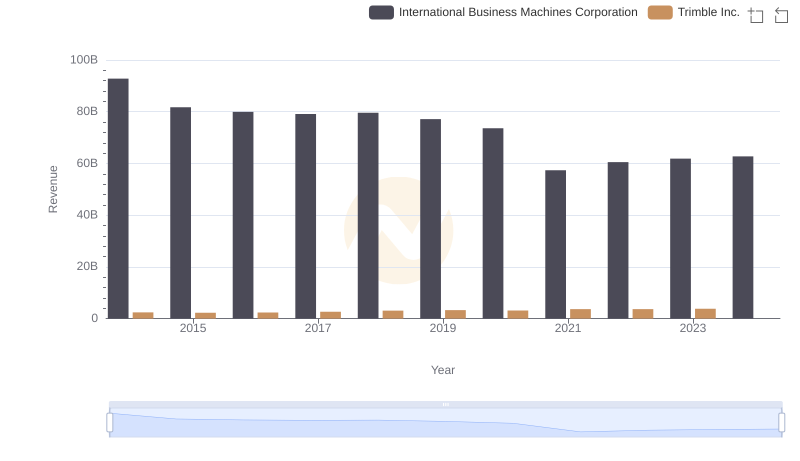
International Business Machines Corporation or Trimble Inc.: Who Leads in Yearly Revenue?
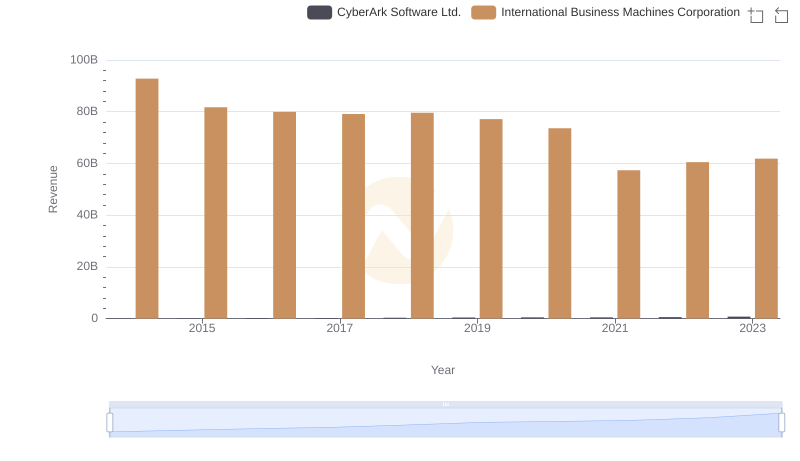
International Business Machines Corporation or CyberArk Software Ltd.: Who Leads in Yearly Revenue?
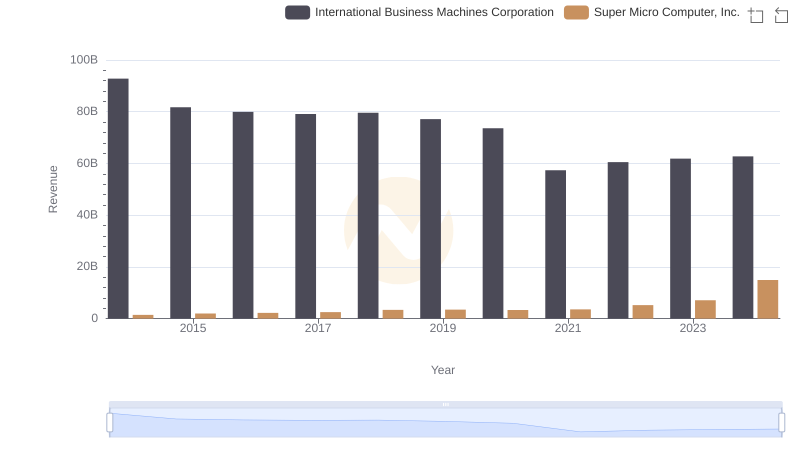
International Business Machines Corporation or Super Micro Computer, Inc.: Who Leads in Yearly Revenue?
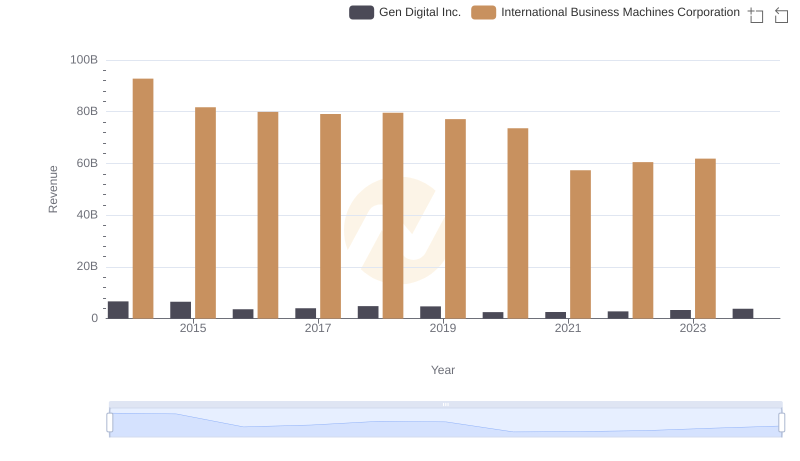
Revenue Insights: International Business Machines Corporation and Gen Digital Inc. Performance Compared
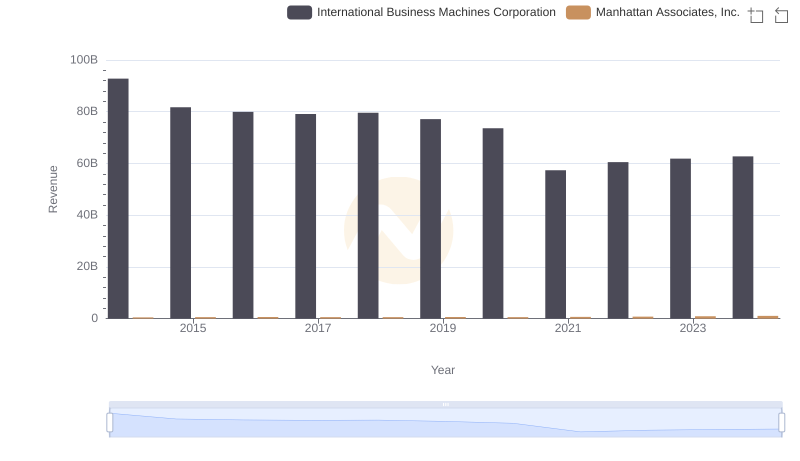
International Business Machines Corporation vs Manhattan Associates, Inc.: Annual Revenue Growth Compared
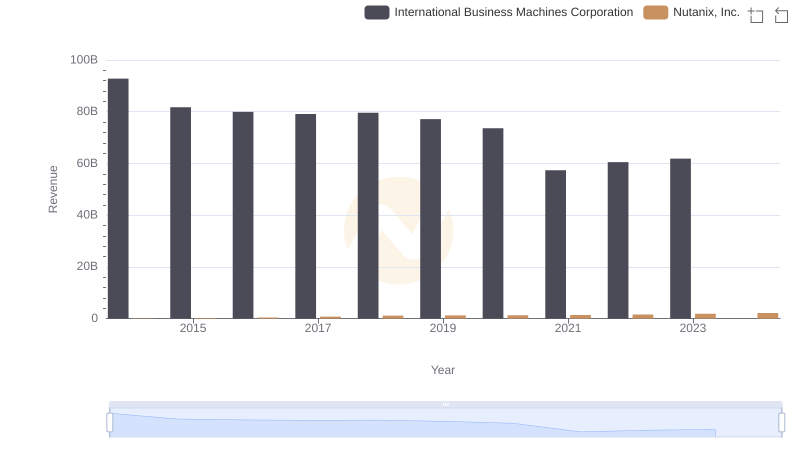
Comparing Revenue Performance: International Business Machines Corporation or Nutanix, Inc.?
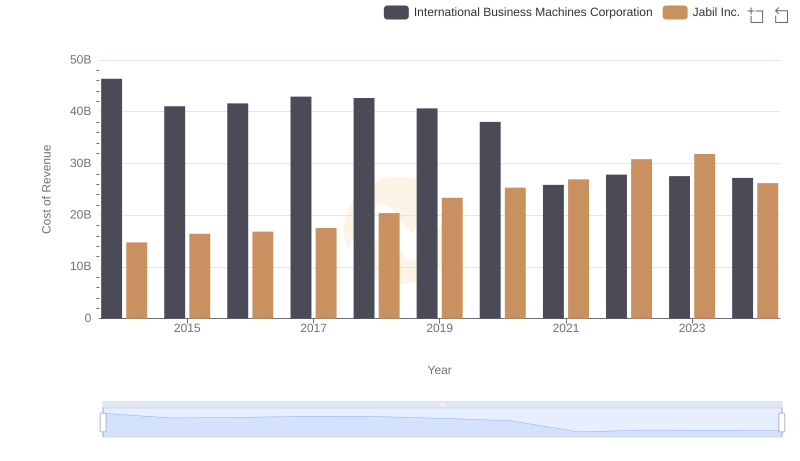
Analyzing Cost of Revenue: International Business Machines Corporation and Jabil Inc.
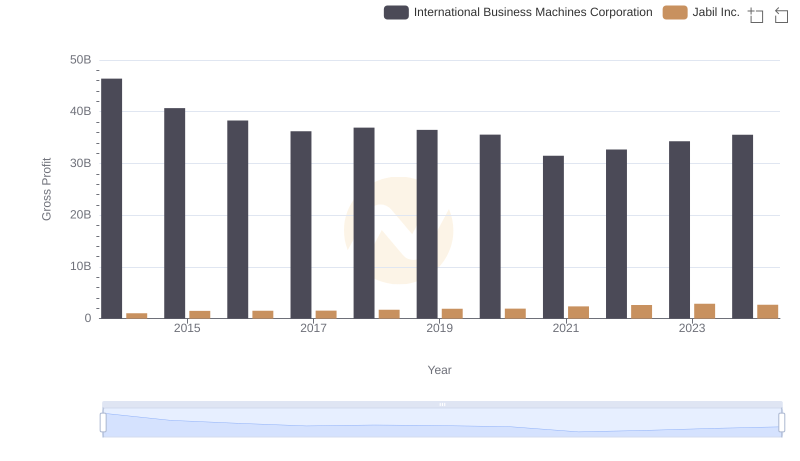
International Business Machines Corporation and Jabil Inc.: A Detailed Gross Profit Analysis
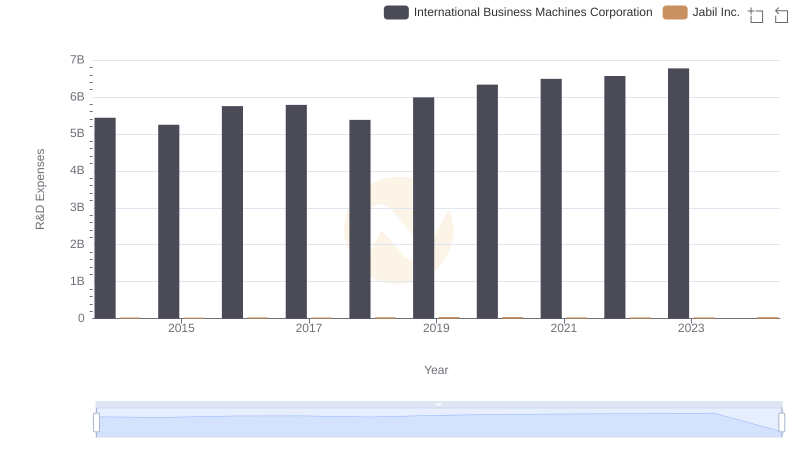
International Business Machines Corporation vs Jabil Inc.: Strategic Focus on R&D Spending
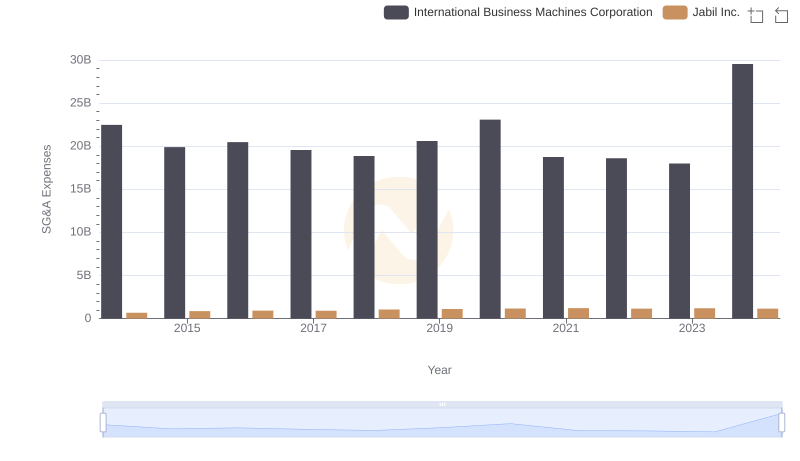
Selling, General, and Administrative Costs: International Business Machines Corporation vs Jabil Inc.
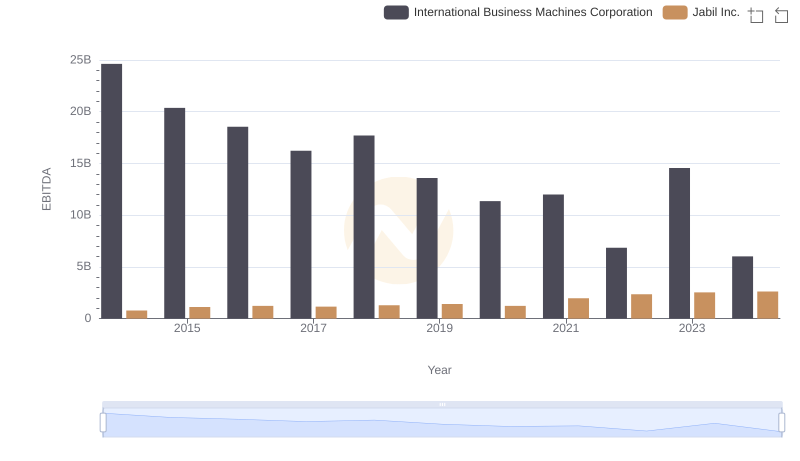
International Business Machines Corporation and Jabil Inc.: A Detailed Examination of EBITDA Performance