| __timestamp | J.B. Hunt Transport Services, Inc. | The Boeing Company |
|---|---|---|
| Wednesday, January 1, 2014 | 5124095000 | 76752000000 |
| Thursday, January 1, 2015 | 5041472000 | 82088000000 |
| Friday, January 1, 2016 | 5369826000 | 80790000000 |
| Sunday, January 1, 2017 | 5990275000 | 76066000000 |
| Monday, January 1, 2018 | 7255657000 | 81490000000 |
| Tuesday, January 1, 2019 | 7659003000 | 72093000000 |
| Wednesday, January 1, 2020 | 8186697000 | 63843000000 |
| Friday, January 1, 2021 | 10298483000 | 59237000000 |
| Saturday, January 1, 2022 | 12341472000 | 63078000000 |
| Sunday, January 1, 2023 | 10433277000 | 70070000000 |
| Monday, January 1, 2024 | 68508000000 |
Data in motion
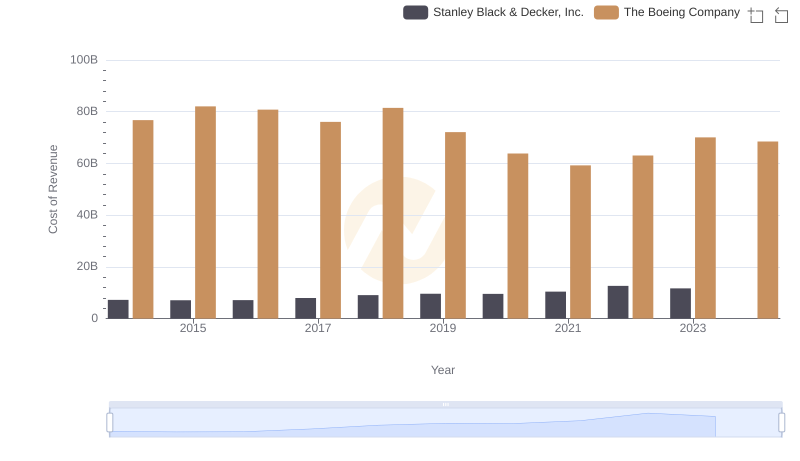
In the ever-evolving landscape of American industry, understanding cost efficiency is crucial. This analysis compares the cost of revenue efficiency between two giants: The Boeing Company and J.B. Hunt Transport Services, Inc., from 2014 to 2023.
Boeing, a leader in aerospace, saw its cost of revenue fluctuate significantly. In 2015, it peaked at approximately $82 billion, but by 2021, it had dropped to around $59 billion, a decrease of nearly 28%. This decline reflects the challenges Boeing faced, including the global pandemic's impact on the aviation sector.
Conversely, J.B. Hunt, a major player in transportation, demonstrated a steady increase in cost of revenue. From 2014 to 2022, it rose by about 140%, reaching over $12 billion. This growth underscores the resilience and expansion of the logistics industry.
Note: Data for J.B. Hunt in 2024 is unavailable, highlighting the need for continuous data monitoring.