| __timestamp | Comfort Systems USA, Inc. | Ingersoll Rand Inc. |
|---|---|---|
| Wednesday, January 1, 2014 | 249771000 | 936781000 |
| Thursday, January 1, 2015 | 318129000 | 779100000 |
| Friday, January 1, 2016 | 344009000 | 716731000 |
| Sunday, January 1, 2017 | 366281000 | 897900000 |
| Monday, January 1, 2018 | 446279000 | 1012500000 |
| Tuesday, January 1, 2019 | 501943000 | 911700000 |
| Wednesday, January 1, 2020 | 546983000 | 1613400000 |
| Friday, January 1, 2021 | 563207000 | 1988500000 |
| Saturday, January 1, 2022 | 741608000 | 2325600000 |
| Sunday, January 1, 2023 | 990509000 | 2882200000 |
| Monday, January 1, 2024 | 0 |
Data in motion
In the competitive landscape of industrial and building solutions, Ingersoll Rand Inc. and Comfort Systems USA, Inc. have shown remarkable growth over the past decade. From 2014 to 2023, Ingersoll Rand's gross profit surged by over 200%, reaching nearly $2.9 billion in 2023. This growth reflects the company's strategic expansions and innovations in industrial technologies.
Meanwhile, Comfort Systems USA, Inc. has also demonstrated impressive progress, with its gross profit increasing by approximately 300% during the same period, peaking at just under $1 billion in 2023. This growth underscores the company's strong foothold in the mechanical services sector, driven by a robust demand for HVAC solutions.
Both companies have capitalized on industry trends, but Ingersoll Rand's larger scale and diversified portfolio have given it a competitive edge, as evidenced by its consistently higher gross profits.
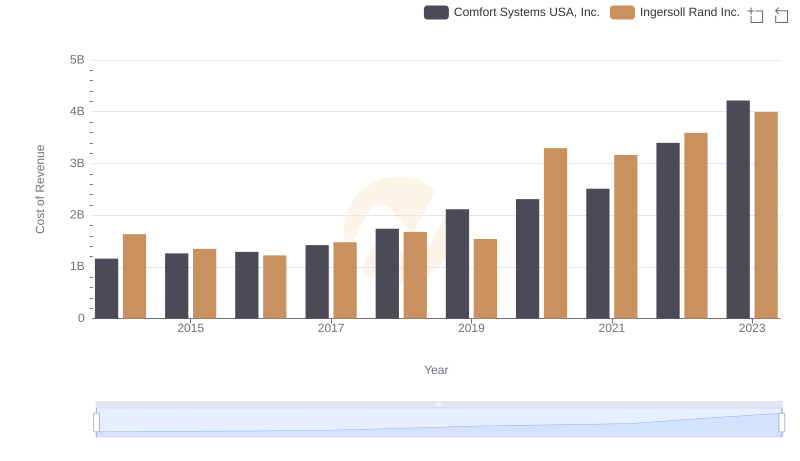
Analyzing Cost of Revenue: Ingersoll Rand Inc. and Comfort Systems USA, Inc.
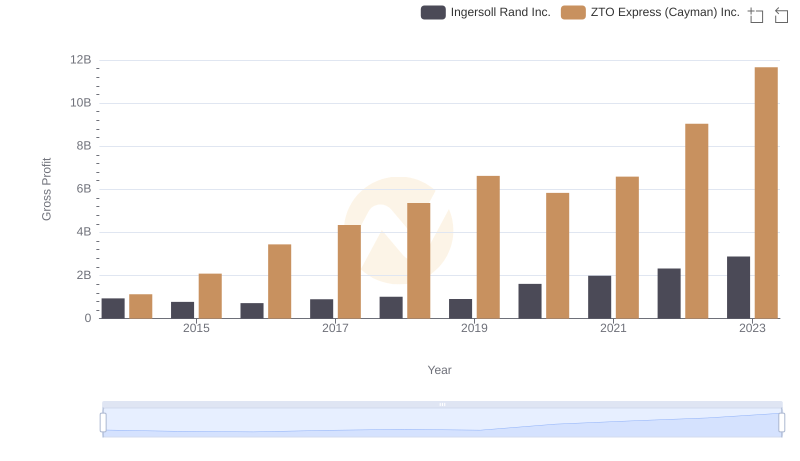
Gross Profit Comparison: Ingersoll Rand Inc. and ZTO Express (Cayman) Inc. Trends
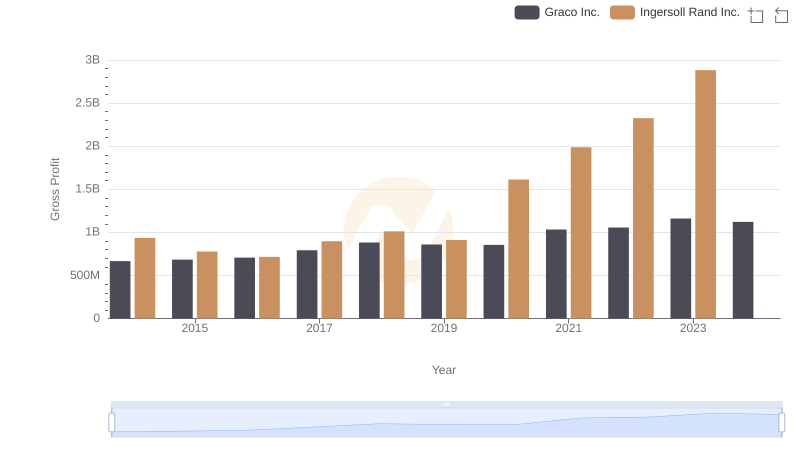
Gross Profit Trends Compared: Ingersoll Rand Inc. vs Graco Inc.
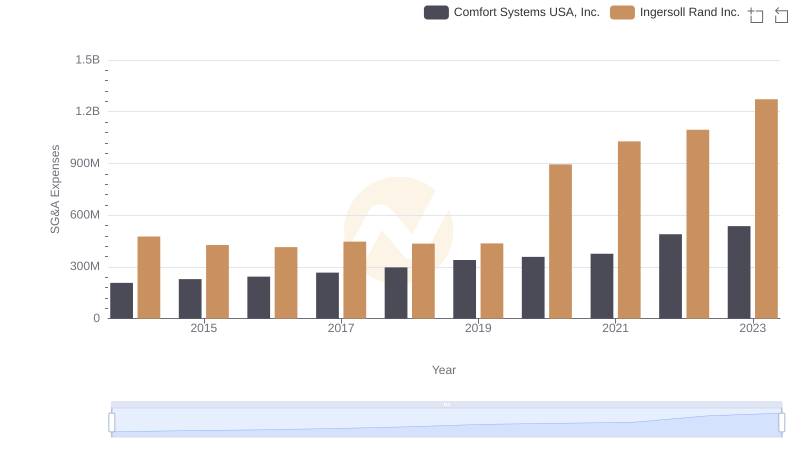
Cost Management Insights: SG&A Expenses for Ingersoll Rand Inc. and Comfort Systems USA, Inc.