| __timestamp | Infosys Limited | VeriSign, Inc. |
|---|---|---|
| Wednesday, January 1, 2014 | 5374000000 | 188425000 |
| Thursday, January 1, 2015 | 5950000000 | 192788000 |
| Friday, January 1, 2016 | 6446000000 | 198242000 |
| Sunday, January 1, 2017 | 7001000000 | 193326000 |
| Monday, January 1, 2018 | 7687000000 | 192134000 |
| Tuesday, January 1, 2019 | 8552000000 | 180467000 |
| Wednesday, January 1, 2020 | 8828000000 | 180177000 |
| Friday, January 1, 2021 | 10996000000 | 191933000 |
| Saturday, January 1, 2022 | 12709000000 | 200700000 |
| Sunday, January 1, 2023 | 13096000000 | 197300000 |
| Monday, January 1, 2024 | 191400000 |
Unleashing insights
In the ever-evolving landscape of global technology, understanding cost structures is pivotal. From 2014 to 2023, Infosys Limited and VeriSign, Inc. have showcased contrasting cost of revenue trends. Infosys, a titan in IT services, saw its cost of revenue surge by approximately 144%, reflecting its expansive growth and operational scaling. In contrast, VeriSign, a leader in domain name registry services, maintained a relatively stable cost structure, with only a 5% increase over the same period. This stark difference highlights Infosys's aggressive market strategies compared to VeriSign's steady operational model. As we delve into these insights, it becomes evident that while Infosys is navigating through rapid expansion, VeriSign is optimizing its existing operations. This analysis not only underscores the strategic directions of these companies but also offers a lens into the broader industry dynamics.
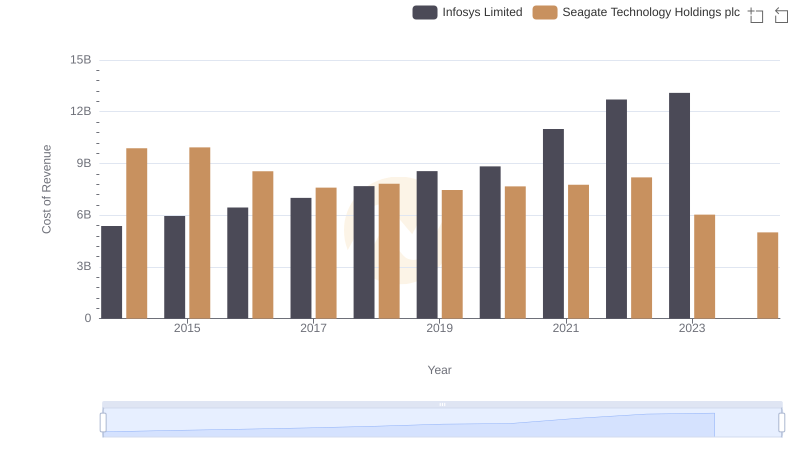
Infosys Limited vs Seagate Technology Holdings plc: Efficiency in Cost of Revenue Explored
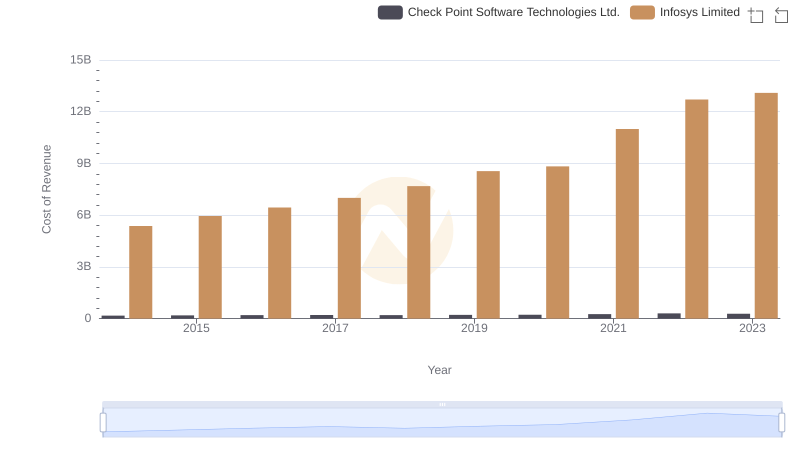
Cost of Revenue Comparison: Infosys Limited vs Check Point Software Technologies Ltd.
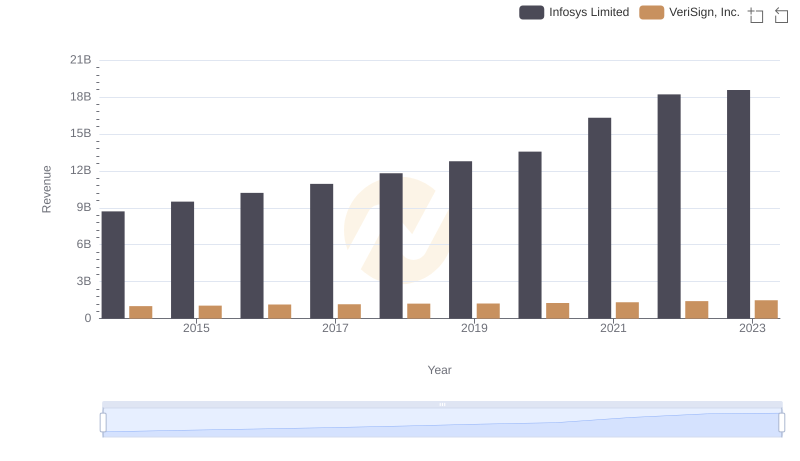
Infosys Limited and VeriSign, Inc.: A Comprehensive Revenue Analysis
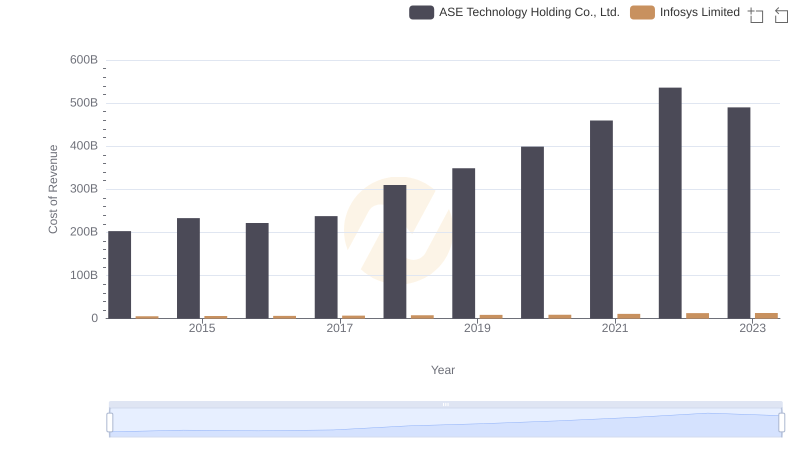
Cost of Revenue: Key Insights for Infosys Limited and ASE Technology Holding Co., Ltd.
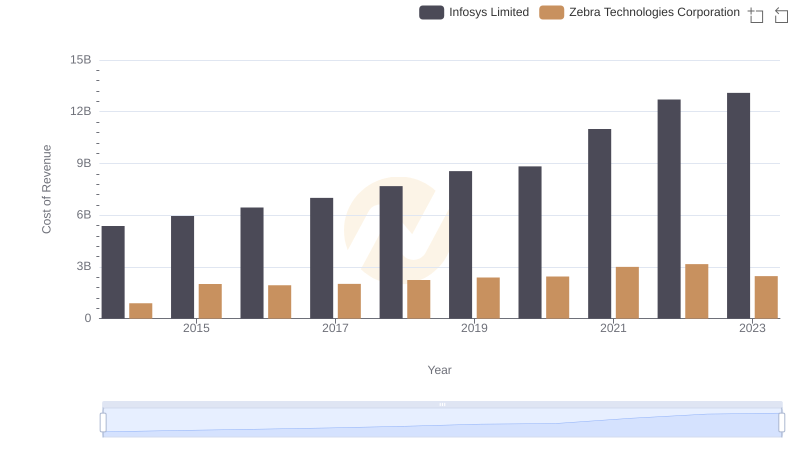
Cost Insights: Breaking Down Infosys Limited and Zebra Technologies Corporation's Expenses
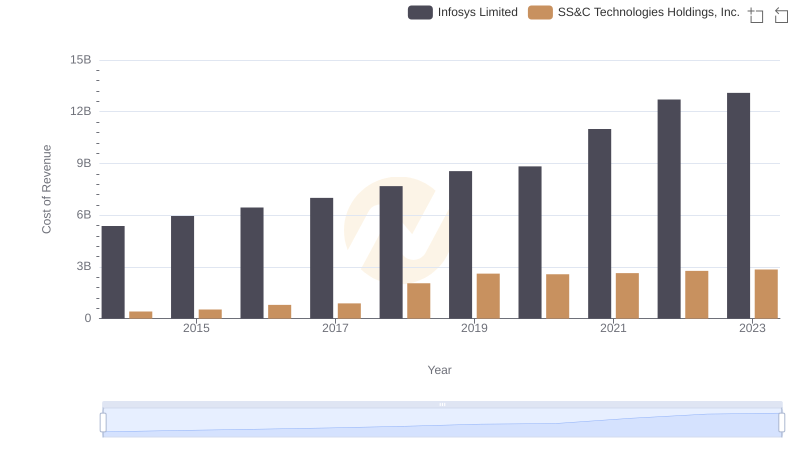
Cost of Revenue Comparison: Infosys Limited vs SS&C Technologies Holdings, Inc.
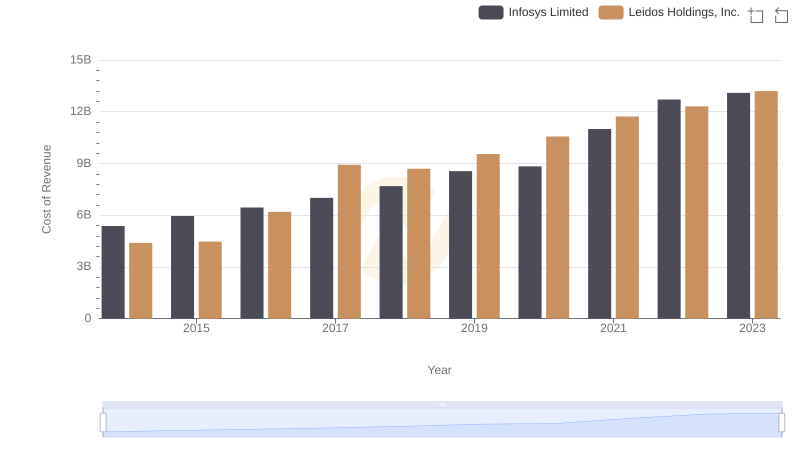
Cost of Revenue: Key Insights for Infosys Limited and Leidos Holdings, Inc.
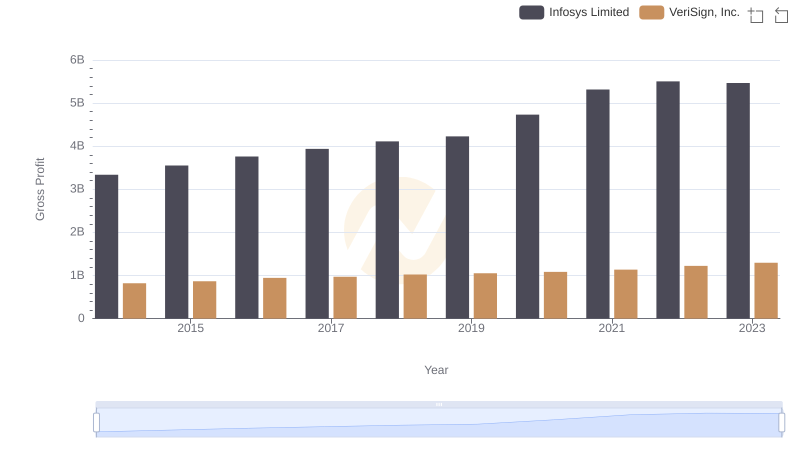
Key Insights on Gross Profit: Infosys Limited vs VeriSign, Inc.
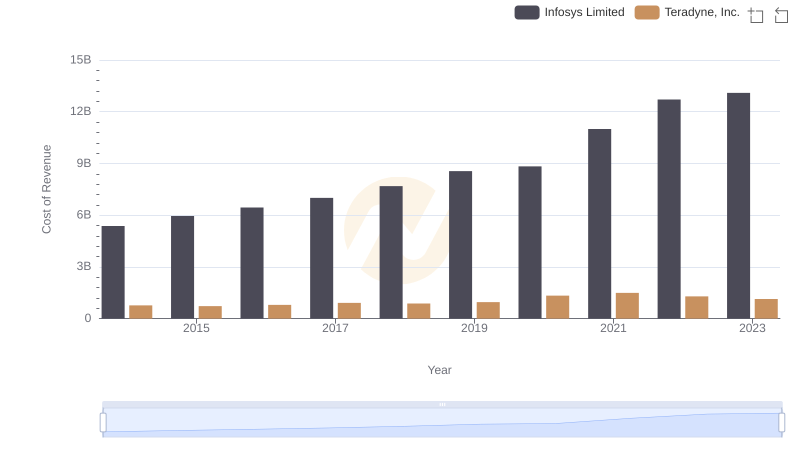
Analyzing Cost of Revenue: Infosys Limited and Teradyne, Inc.
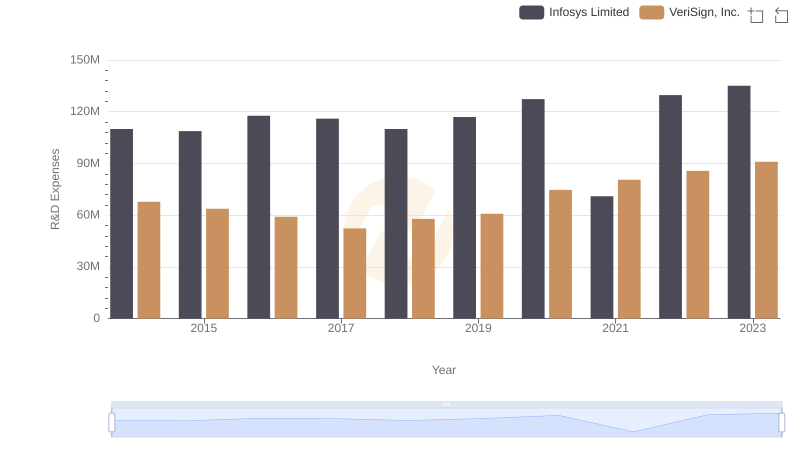
Infosys Limited or VeriSign, Inc.: Who Invests More in Innovation?
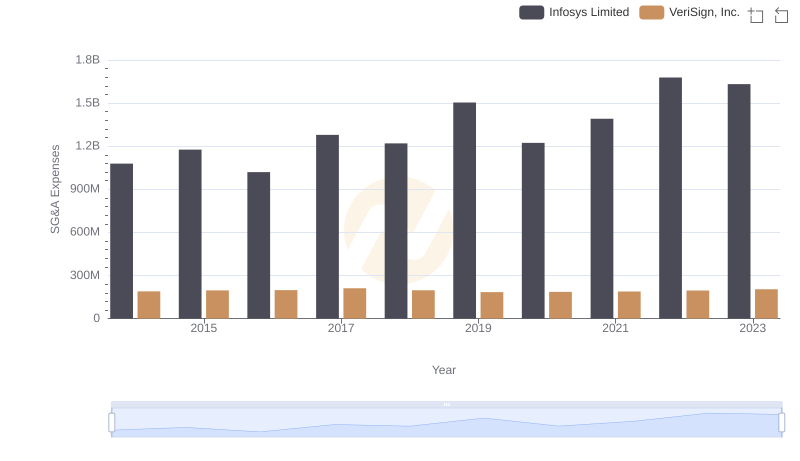
Cost Management Insights: SG&A Expenses for Infosys Limited and VeriSign, Inc.
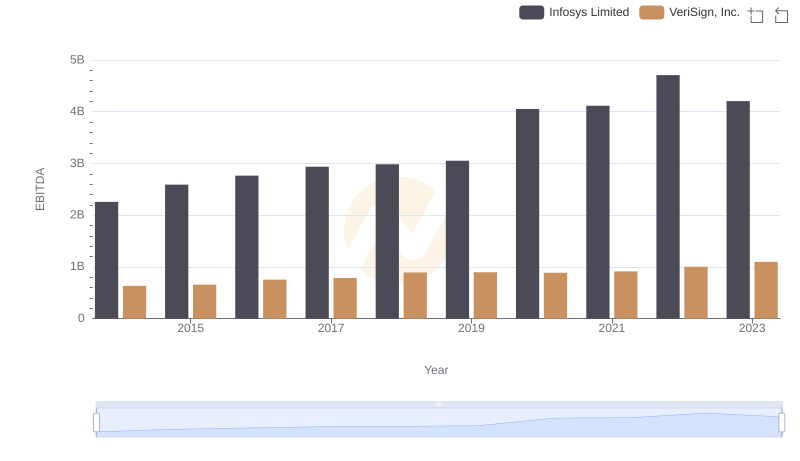
EBITDA Analysis: Evaluating Infosys Limited Against VeriSign, Inc.