| __timestamp | Caterpillar Inc. | RTX Corporation |
|---|---|---|
| Wednesday, January 1, 2014 | 40391000000 | 47447000000 |
| Thursday, January 1, 2015 | 34133000000 | 40431000000 |
| Friday, January 1, 2016 | 28905000000 | 41460000000 |
| Sunday, January 1, 2017 | 31695000000 | 43953000000 |
| Monday, January 1, 2018 | 37719000000 | 49985000000 |
| Tuesday, January 1, 2019 | 37384000000 | 57065000000 |
| Wednesday, January 1, 2020 | 29671000000 | 48056000000 |
| Friday, January 1, 2021 | 35968000000 | 51897000000 |
| Saturday, January 1, 2022 | 41915000000 | 53406000000 |
| Sunday, January 1, 2023 | 43797000000 | 56831000000 |
| Monday, January 1, 2024 | 41485000000 | 65328000000 |
Unleashing the power of data
In the ever-evolving landscape of industrial and defense sectors, Caterpillar Inc. and RTX Corporation stand as titans. From 2014 to 2023, these companies have showcased intriguing trends in their cost of revenue. Caterpillar Inc. experienced a notable dip in 2016, with costs dropping by approximately 28% from 2014 levels, before rebounding to a peak in 2023. Meanwhile, RTX Corporation's cost of revenue has shown a steady upward trajectory, increasing by about 38% over the same period. This divergence highlights the distinct operational strategies and market conditions faced by each company. Notably, RTX's data for 2024 is available, indicating a continued rise, while Caterpillar's data for the same year remains elusive. This analysis not only underscores the resilience and adaptability of these industry leaders but also invites further exploration into the factors driving these financial dynamics.
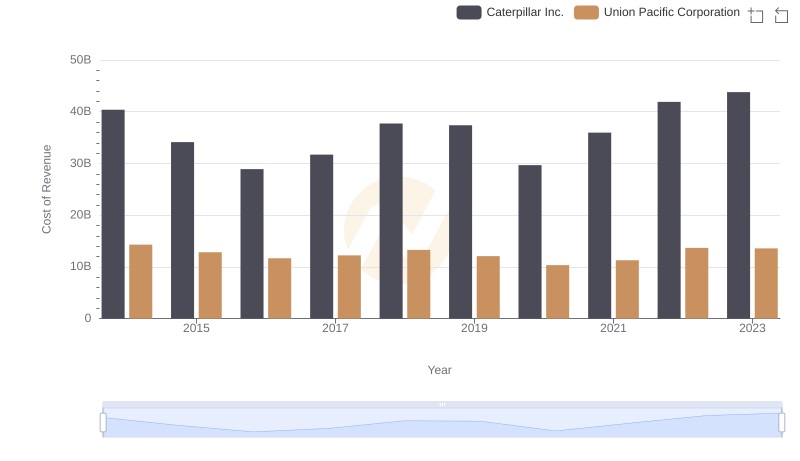
Caterpillar Inc. vs Union Pacific Corporation: Efficiency in Cost of Revenue Explored

Caterpillar Inc. vs RTX Corporation: A Gross Profit Performance Breakdown
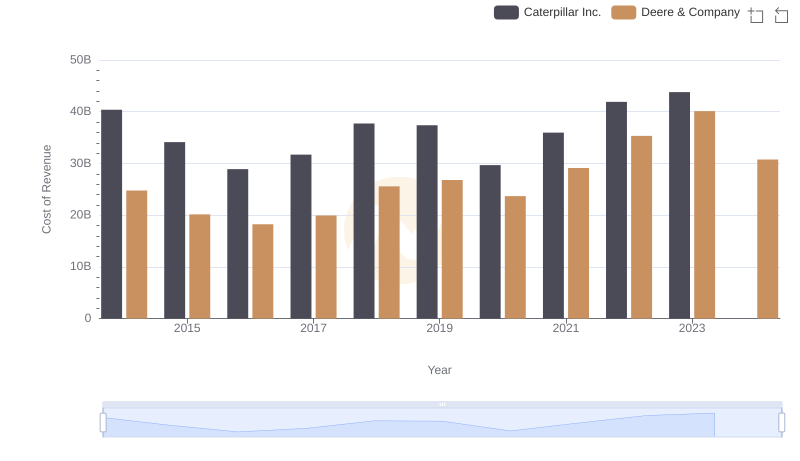
Comparing Cost of Revenue Efficiency: Caterpillar Inc. vs Deere & Company

Caterpillar Inc. vs Honeywell International Inc.: Efficiency in Cost of Revenue Explored

Cost of Revenue: Key Insights for Caterpillar Inc. and Eaton Corporation plc
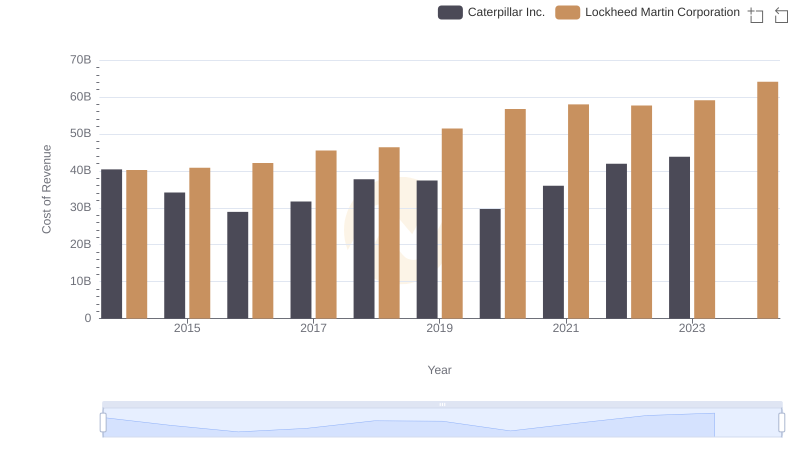
Cost Insights: Breaking Down Caterpillar Inc. and Lockheed Martin Corporation's Expenses
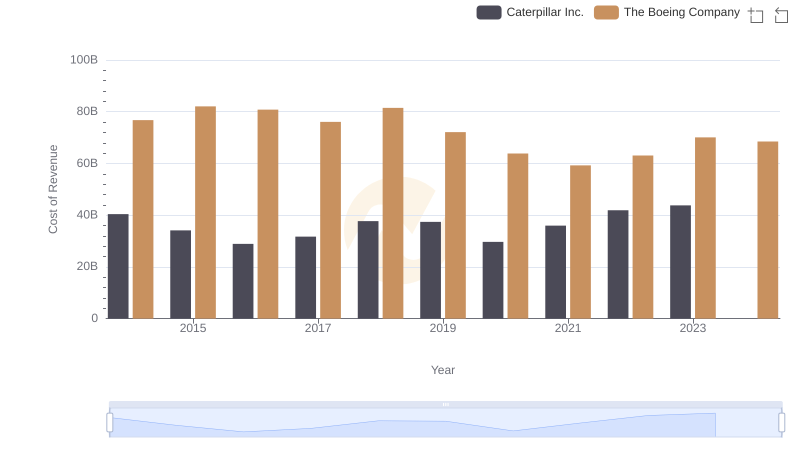
Comparing Cost of Revenue Efficiency: Caterpillar Inc. vs The Boeing Company

Caterpillar Inc. vs United Parcel Service, Inc.: Efficiency in Cost of Revenue Explored

Comparing SG&A Expenses: Caterpillar Inc. vs RTX Corporation Trends and Insights