| __timestamp | Caterpillar Inc. | United Parcel Service, Inc. |
|---|---|---|
| Wednesday, January 1, 2014 | 40391000000 | 32045000000 |
| Thursday, January 1, 2015 | 34133000000 | 31028000000 |
| Friday, January 1, 2016 | 28905000000 | 55439000000 |
| Sunday, January 1, 2017 | 31695000000 | 58343000000 |
| Monday, January 1, 2018 | 37719000000 | 64837000000 |
| Tuesday, January 1, 2019 | 37384000000 | 66296000000 |
| Wednesday, January 1, 2020 | 29671000000 | 76814000000 |
| Friday, January 1, 2021 | 35968000000 | 84477000000 |
| Saturday, January 1, 2022 | 41915000000 | 87244000000 |
| Sunday, January 1, 2023 | 43797000000 | 73727000000 |
| Monday, January 1, 2024 | 41485000000 | 66048000000 |
Unveiling the hidden dimensions of data
In the ever-evolving landscape of industrial giants, understanding cost efficiency is paramount. This analysis delves into the cost of revenue trends for Caterpillar Inc. and United Parcel Service, Inc. from 2014 to 2023. Over this period, Caterpillar's cost of revenue fluctuated, peaking in 2023 with a 51% increase from its 2016 low. Meanwhile, UPS demonstrated a more consistent upward trajectory, with a notable 181% rise from 2014 to 2022, before a slight dip in 2023. This comparison highlights UPS's robust growth strategy, while Caterpillar's cost management reflects its adaptive approach to market challenges. As these industry leaders navigate economic shifts, their cost efficiency strategies offer valuable insights into their operational resilience and market positioning.
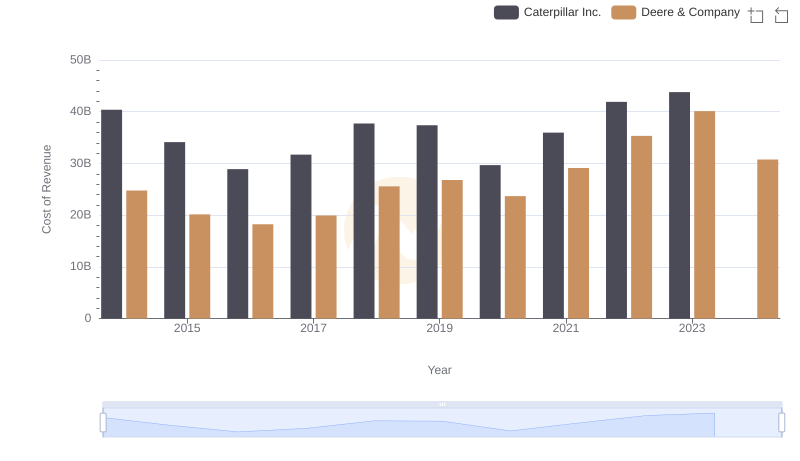
Comparing Cost of Revenue Efficiency: Caterpillar Inc. vs Deere & Company
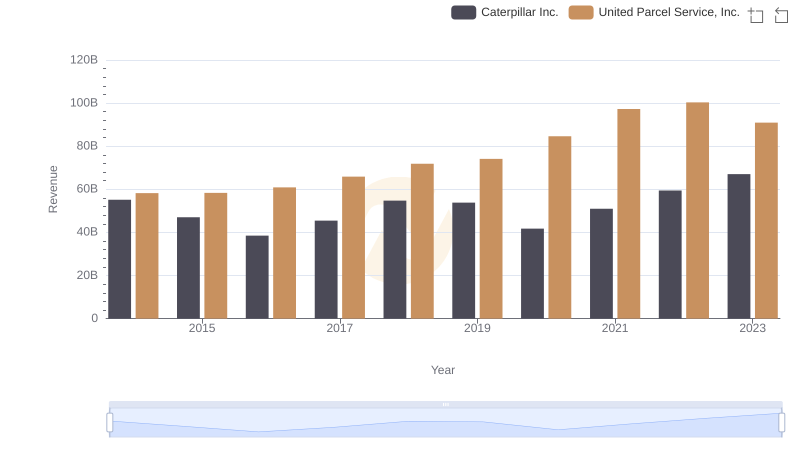
Who Generates More Revenue? Caterpillar Inc. or United Parcel Service, Inc.

Caterpillar Inc. vs Honeywell International Inc.: Efficiency in Cost of Revenue Explored

Cost of Revenue: Key Insights for Caterpillar Inc. and Eaton Corporation plc
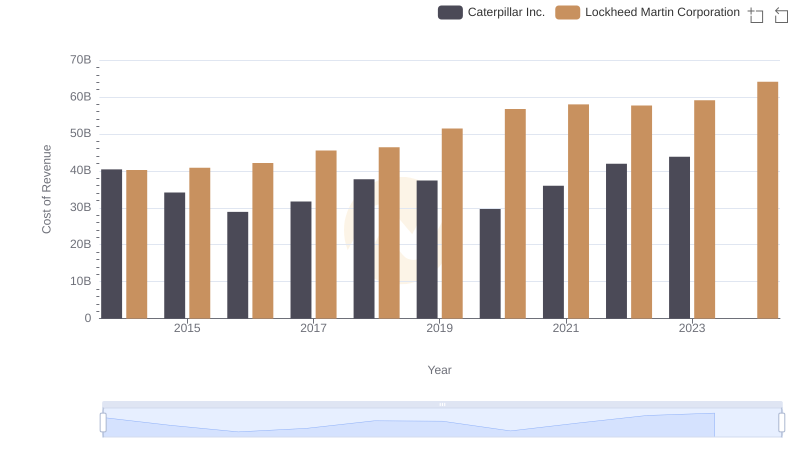
Cost Insights: Breaking Down Caterpillar Inc. and Lockheed Martin Corporation's Expenses
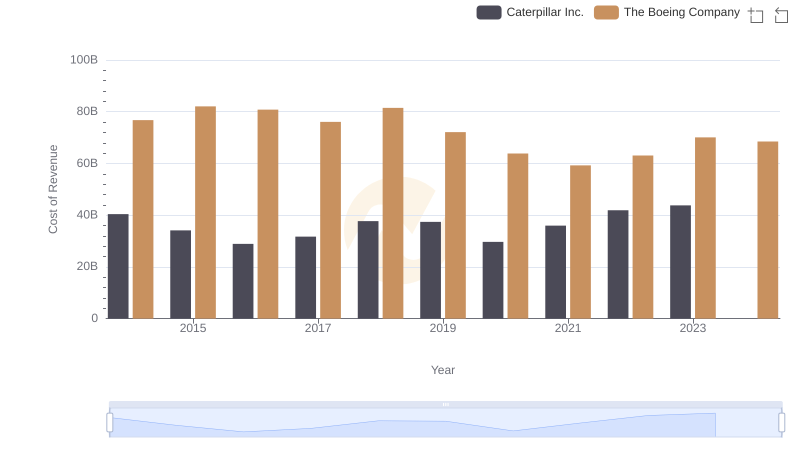
Comparing Cost of Revenue Efficiency: Caterpillar Inc. vs The Boeing Company

Caterpillar Inc. vs Automatic Data Processing, Inc.: Efficiency in Cost of Revenue Explored
Cost of Revenue Comparison: Caterpillar Inc. vs Parker-Hannifin Corporation