| __timestamp | Caterpillar Inc. | Union Pacific Corporation |
|---|---|---|
| Wednesday, January 1, 2014 | 40391000000 | 14311000000 |
| Thursday, January 1, 2015 | 34133000000 | 12837000000 |
| Friday, January 1, 2016 | 28905000000 | 11672000000 |
| Sunday, January 1, 2017 | 31695000000 | 12231000000 |
| Monday, January 1, 2018 | 37719000000 | 13293000000 |
| Tuesday, January 1, 2019 | 37384000000 | 12094000000 |
| Wednesday, January 1, 2020 | 29671000000 | 10354000000 |
| Friday, January 1, 2021 | 35968000000 | 11290000000 |
| Saturday, January 1, 2022 | 41915000000 | 13670000000 |
| Sunday, January 1, 2023 | 43797000000 | 13590000000 |
| Monday, January 1, 2024 | 41485000000 | 13211000000 |
Data in motion
In the ever-evolving landscape of industrial giants, understanding cost efficiency is crucial. Caterpillar Inc. and Union Pacific Corporation, two titans in their respective fields, have shown distinct trends in their cost of revenue from 2014 to 2023. Caterpillar's cost of revenue has fluctuated, peaking in 2023 with a 51% increase from its lowest point in 2016. Meanwhile, Union Pacific's cost of revenue has remained relatively stable, with a slight decrease of 5% over the same period. This data highlights Caterpillar's dynamic cost management strategies compared to Union Pacific's steady approach. As businesses navigate economic challenges, these insights into cost efficiency can guide strategic decisions, offering a glimpse into the operational prowess of these industry leaders.
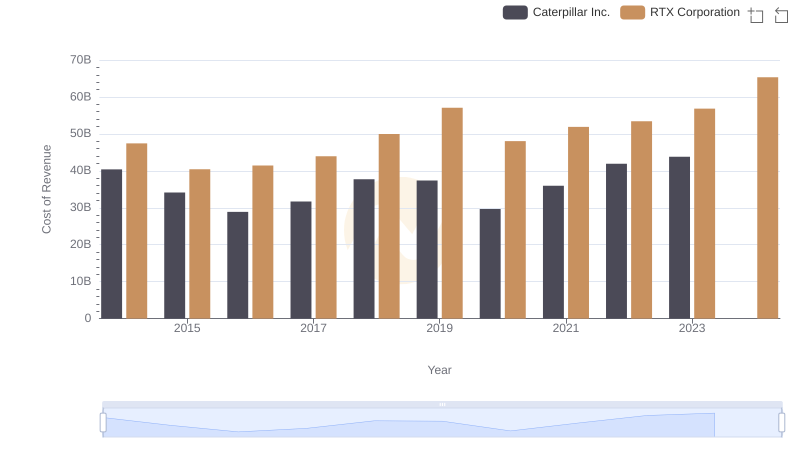
Analyzing Cost of Revenue: Caterpillar Inc. and RTX Corporation
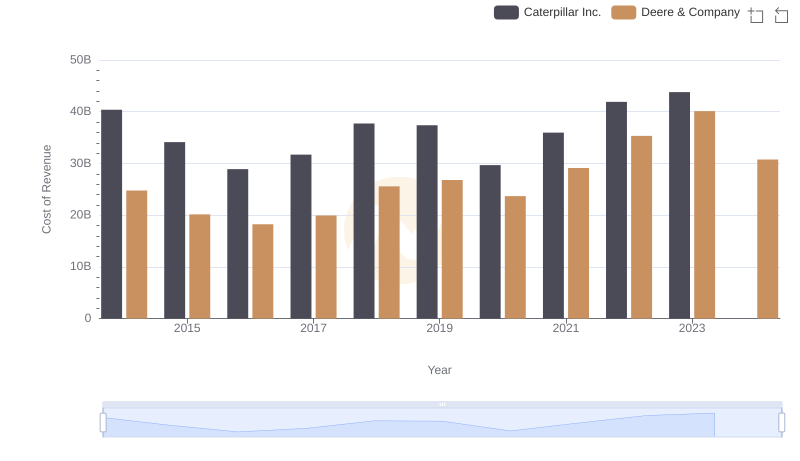
Comparing Cost of Revenue Efficiency: Caterpillar Inc. vs Deere & Company

Caterpillar Inc. vs Honeywell International Inc.: Efficiency in Cost of Revenue Explored

Cost of Revenue: Key Insights for Caterpillar Inc. and Eaton Corporation plc
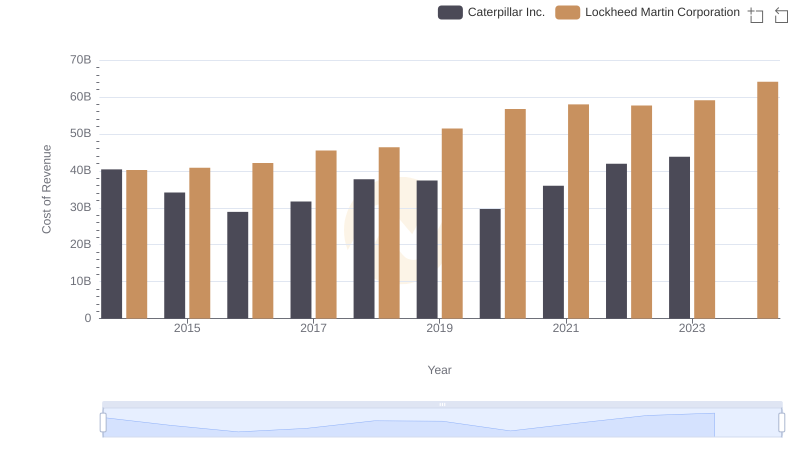
Cost Insights: Breaking Down Caterpillar Inc. and Lockheed Martin Corporation's Expenses
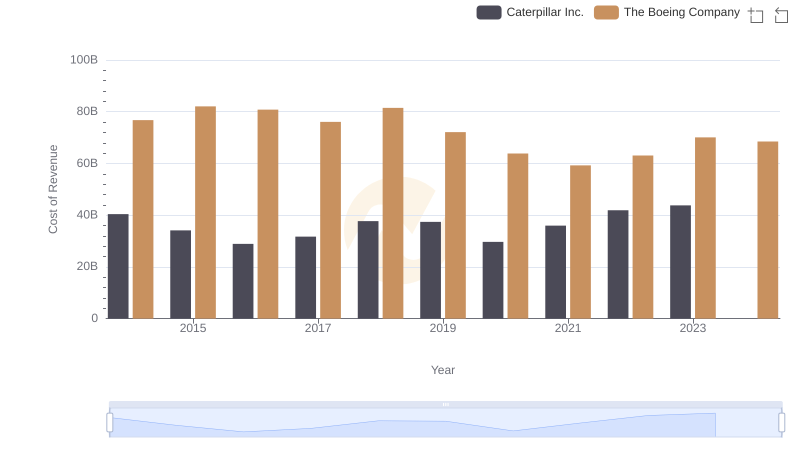
Comparing Cost of Revenue Efficiency: Caterpillar Inc. vs The Boeing Company

Caterpillar Inc. vs United Parcel Service, Inc.: Efficiency in Cost of Revenue Explored

Caterpillar Inc. vs Automatic Data Processing, Inc.: Efficiency in Cost of Revenue Explored