| __timestamp | Caterpillar Inc. | Lockheed Martin Corporation |
|---|---|---|
| Wednesday, January 1, 2014 | 40391000000 | 40226000000 |
| Thursday, January 1, 2015 | 34133000000 | 40830000000 |
| Friday, January 1, 2016 | 28905000000 | 42106000000 |
| Sunday, January 1, 2017 | 31695000000 | 45500000000 |
| Monday, January 1, 2018 | 37719000000 | 46392000000 |
| Tuesday, January 1, 2019 | 37384000000 | 51445000000 |
| Wednesday, January 1, 2020 | 29671000000 | 56744000000 |
| Friday, January 1, 2021 | 35968000000 | 57983000000 |
| Saturday, January 1, 2022 | 41915000000 | 57697000000 |
| Sunday, January 1, 2023 | 43797000000 | 59092000000 |
| Monday, January 1, 2024 | 41485000000 | 64113000000 |
Unveiling the hidden dimensions of data
In the ever-evolving landscape of industrial manufacturing and defense, Caterpillar Inc. and Lockheed Martin Corporation stand as titans. Over the past decade, these companies have navigated fluctuating economic conditions, with their cost of revenue reflecting strategic shifts and market demands. From 2014 to 2023, Caterpillar's cost of revenue saw a notable dip in 2016, reaching a low of approximately $28.9 billion, before rebounding by 2023 to around $43.8 billion, marking a 52% increase. Meanwhile, Lockheed Martin's cost of revenue consistently climbed, peaking at $59.1 billion in 2023, a 47% rise from 2014. This upward trend underscores Lockheed Martin's expanding footprint in the defense sector. Notably, 2024 data for Caterpillar is missing, hinting at potential shifts or reporting delays. These insights offer a window into the strategic maneuvers of these industry leaders, reflecting broader economic and sector-specific trends.
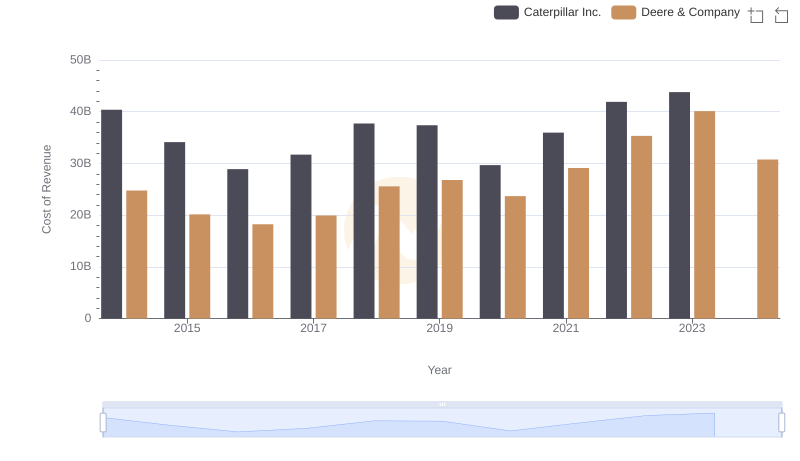
Comparing Cost of Revenue Efficiency: Caterpillar Inc. vs Deere & Company
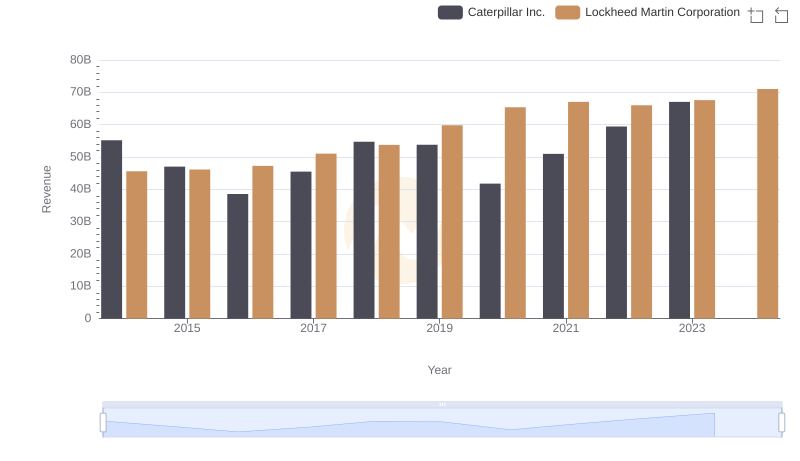
Caterpillar Inc. vs Lockheed Martin Corporation: Examining Key Revenue Metrics

Caterpillar Inc. vs Honeywell International Inc.: Efficiency in Cost of Revenue Explored

Cost of Revenue: Key Insights for Caterpillar Inc. and Eaton Corporation plc
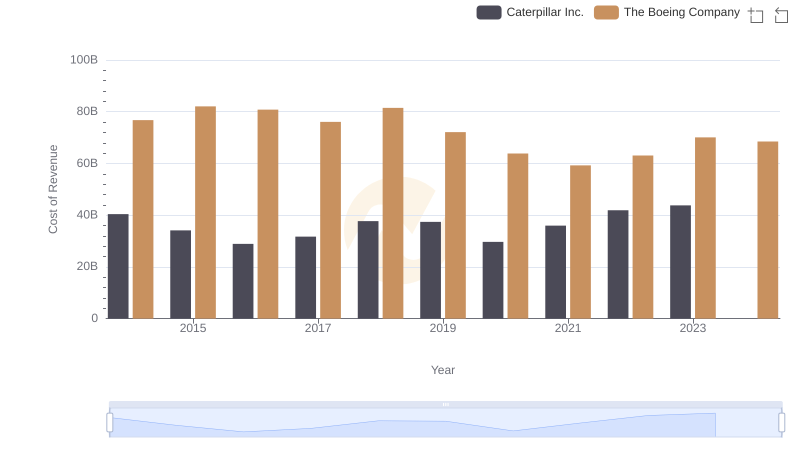
Comparing Cost of Revenue Efficiency: Caterpillar Inc. vs The Boeing Company

Caterpillar Inc. vs United Parcel Service, Inc.: Efficiency in Cost of Revenue Explored

Caterpillar Inc. vs Automatic Data Processing, Inc.: Efficiency in Cost of Revenue Explored

Gross Profit Comparison: Caterpillar Inc. and Lockheed Martin Corporation Trends
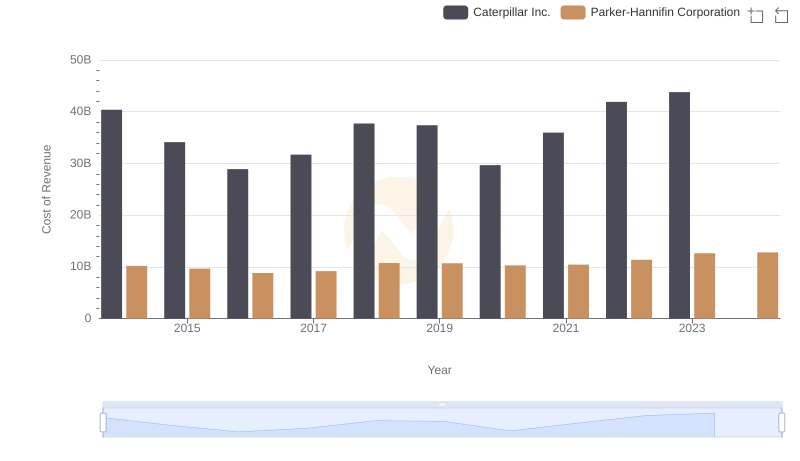
Cost of Revenue Comparison: Caterpillar Inc. vs Parker-Hannifin Corporation