| __timestamp | Caterpillar Inc. | Eaton Corporation plc |
|---|---|---|
| Wednesday, January 1, 2014 | 40391000000 | 15646000000 |
| Thursday, January 1, 2015 | 34133000000 | 14292000000 |
| Friday, January 1, 2016 | 28905000000 | 13400000000 |
| Sunday, January 1, 2017 | 31695000000 | 13756000000 |
| Monday, January 1, 2018 | 37719000000 | 14511000000 |
| Tuesday, January 1, 2019 | 37384000000 | 14338000000 |
| Wednesday, January 1, 2020 | 29671000000 | 12408000000 |
| Friday, January 1, 2021 | 35968000000 | 13293000000 |
| Saturday, January 1, 2022 | 41915000000 | 13865000000 |
| Sunday, January 1, 2023 | 43797000000 | 14763000000 |
| Monday, January 1, 2024 | 41485000000 | 15375000000 |
Infusing magic into the data realm
In the ever-evolving landscape of industrial manufacturing, understanding cost dynamics is crucial. Caterpillar Inc. and Eaton Corporation plc, two titans in the sector, have shown intriguing trends in their cost of revenue from 2014 to 2023. Caterpillar's cost of revenue peaked in 2023, marking a 50% increase from its 2016 low. This upward trajectory reflects strategic investments and market expansion. Meanwhile, Eaton Corporation's cost of revenue remained relatively stable, with a slight dip in 2020, likely due to global economic disruptions. By 2023, Eaton's cost of revenue rebounded to near its 2014 levels, showcasing resilience and adaptability. These insights highlight the contrasting strategies of these industry leaders, offering valuable lessons in financial management and operational efficiency.
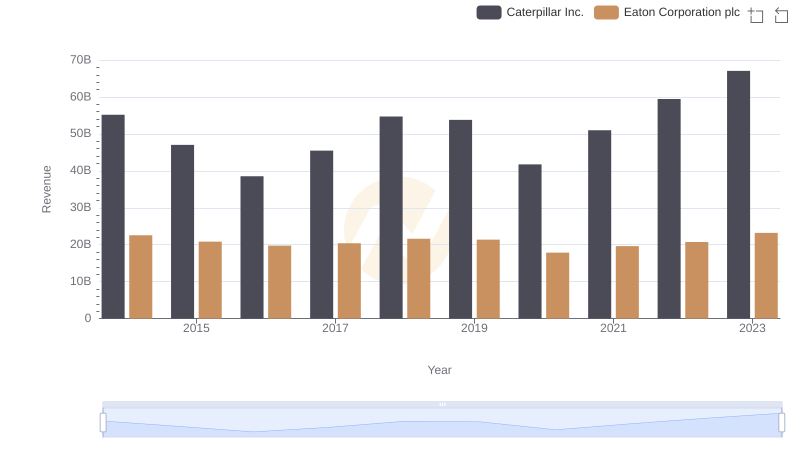
Revenue Insights: Caterpillar Inc. and Eaton Corporation plc Performance Compared
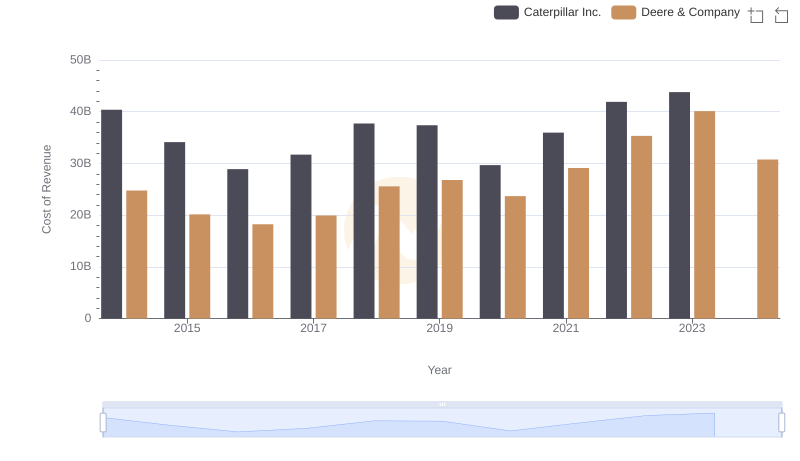
Comparing Cost of Revenue Efficiency: Caterpillar Inc. vs Deere & Company

Caterpillar Inc. vs Honeywell International Inc.: Efficiency in Cost of Revenue Explored
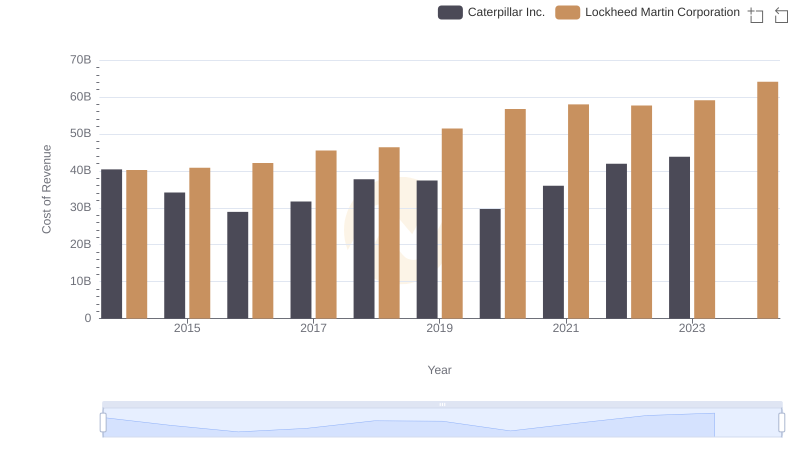
Cost Insights: Breaking Down Caterpillar Inc. and Lockheed Martin Corporation's Expenses
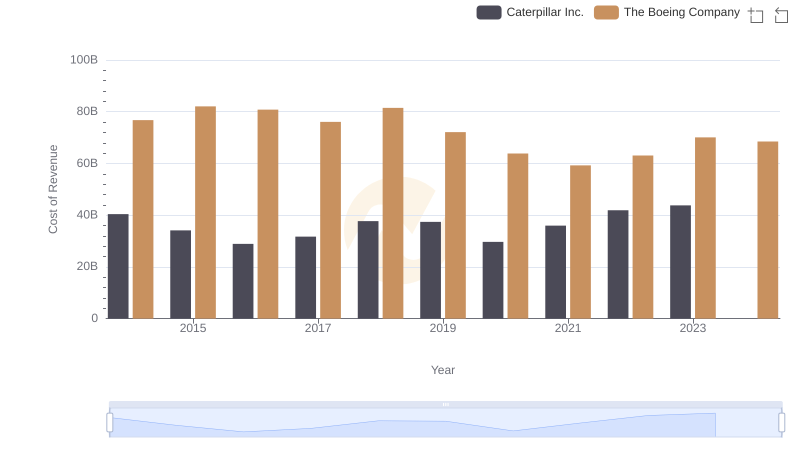
Comparing Cost of Revenue Efficiency: Caterpillar Inc. vs The Boeing Company

Caterpillar Inc. vs United Parcel Service, Inc.: Efficiency in Cost of Revenue Explored

Caterpillar Inc. vs Automatic Data Processing, Inc.: Efficiency in Cost of Revenue Explored
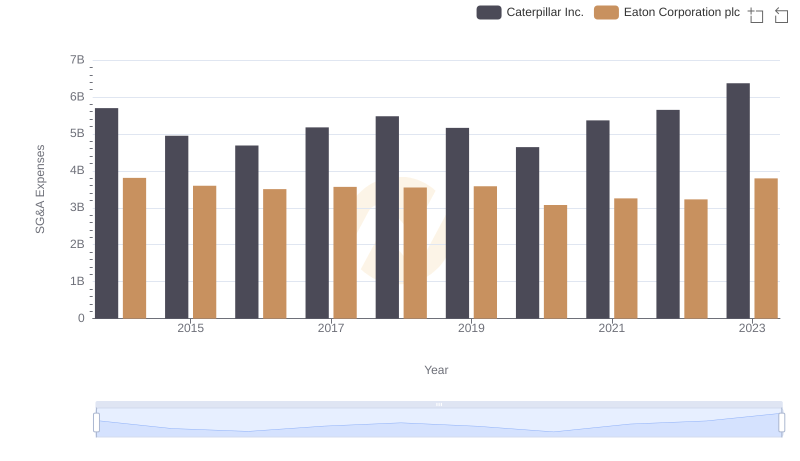
Caterpillar Inc. or Eaton Corporation plc: Who Manages SG&A Costs Better?
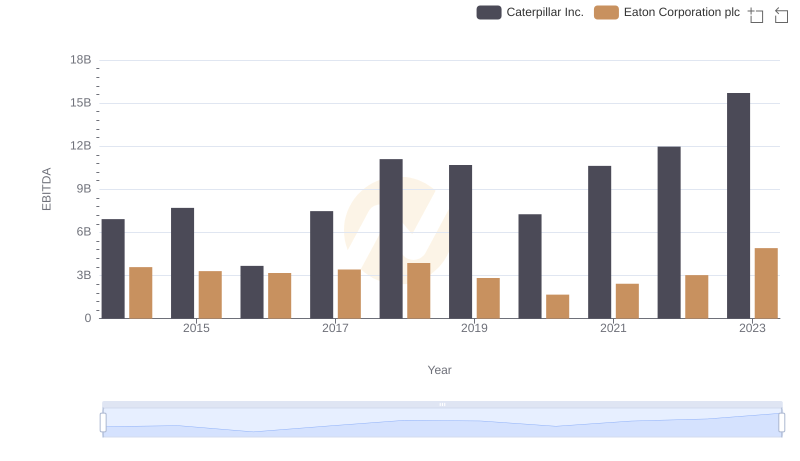
Caterpillar Inc. and Eaton Corporation plc: A Detailed Examination of EBITDA Performance