| __timestamp | Caterpillar Inc. | RTX Corporation |
|---|---|---|
| Wednesday, January 1, 2014 | 5697000000 | 6500000000 |
| Thursday, January 1, 2015 | 4951000000 | 5886000000 |
| Friday, January 1, 2016 | 4686000000 | 6060000000 |
| Sunday, January 1, 2017 | 5177000000 | 6183000000 |
| Monday, January 1, 2018 | 5478000000 | 7066000000 |
| Tuesday, January 1, 2019 | 5162000000 | 8521000000 |
| Wednesday, January 1, 2020 | 4642000000 | 5540000000 |
| Friday, January 1, 2021 | 5365000000 | 5224000000 |
| Saturday, January 1, 2022 | 5651000000 | 5663000000 |
| Sunday, January 1, 2023 | 6371000000 | 4029000000 |
| Monday, January 1, 2024 | 6667000000 | 5806000000 |
Unlocking the unknown
In the ever-evolving landscape of industrial and defense sectors, understanding the financial health of key players is crucial. This analysis delves into the Selling, General, and Administrative (SG&A) expenses of Caterpillar Inc. and RTX Corporation from 2014 to 2023.
Caterpillar Inc. has shown a steady increase in SG&A expenses, peaking in 2023 with a 36% rise from its lowest point in 2020. Meanwhile, RTX Corporation experienced a significant fluctuation, with a notable 53% drop in 2023 compared to its 2019 peak. This volatility highlights the dynamic nature of the defense industry, influenced by geopolitical factors and market demands.
It's important to note the absence of Caterpillar's data for 2024, which could impact future trend analysis. As these companies navigate global challenges, their financial strategies will be pivotal in shaping their competitive edge.
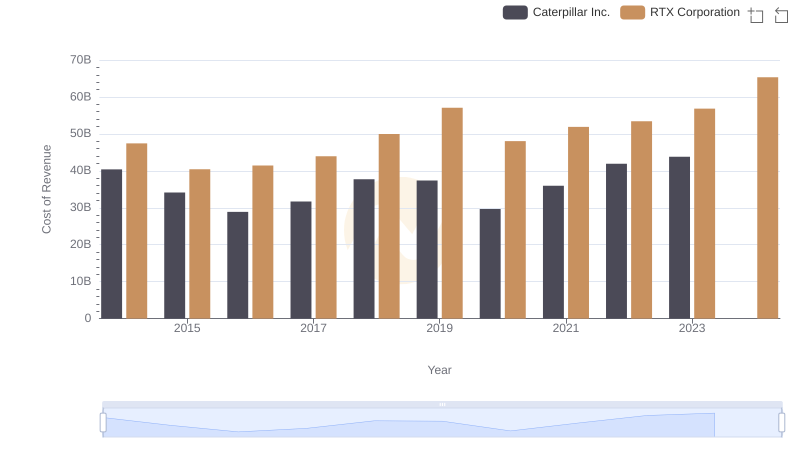
Analyzing Cost of Revenue: Caterpillar Inc. and RTX Corporation

Caterpillar Inc. vs RTX Corporation: A Gross Profit Performance Breakdown

Cost Management Insights: SG&A Expenses for Caterpillar Inc. and The Boeing Company

SG&A Efficiency Analysis: Comparing Caterpillar Inc. and Honeywell International Inc.
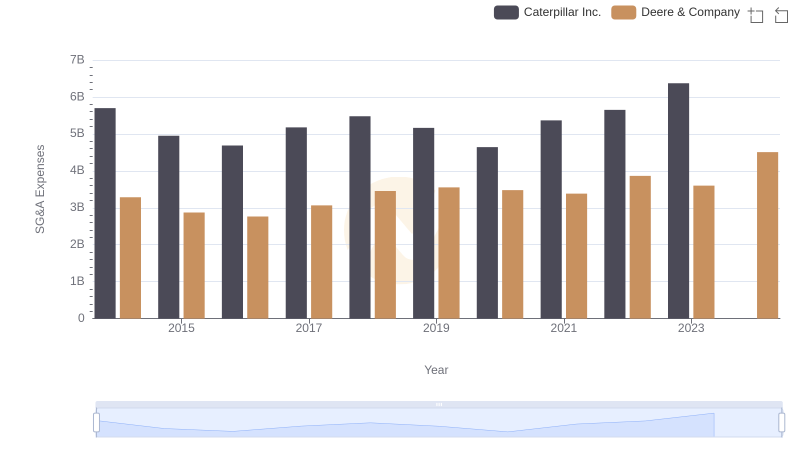
Operational Costs Compared: SG&A Analysis of Caterpillar Inc. and Deere & Company
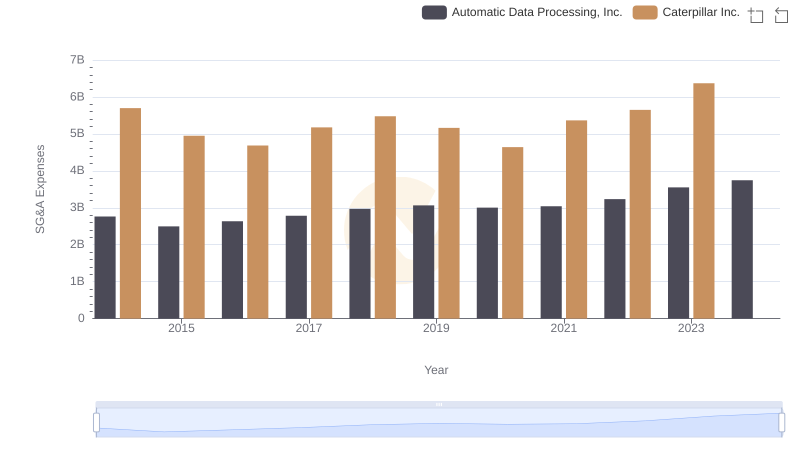
Who Optimizes SG&A Costs Better? Caterpillar Inc. or Automatic Data Processing, Inc.
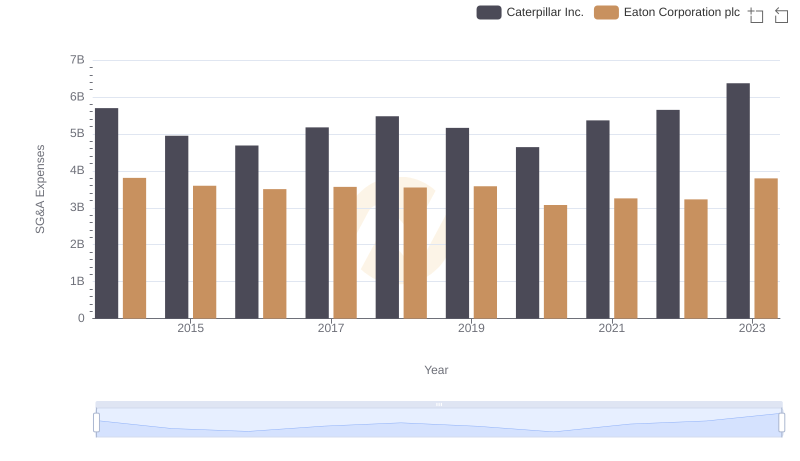
Caterpillar Inc. or Eaton Corporation plc: Who Manages SG&A Costs Better?
Comparing SG&A Expenses: Caterpillar Inc. vs Cintas Corporation Trends and Insights