| __timestamp | Caterpillar Inc. | RTX Corporation |
|---|---|---|
| Wednesday, January 1, 2014 | 14793000000 | 17653000000 |
| Thursday, January 1, 2015 | 12878000000 | 15667000000 |
| Friday, January 1, 2016 | 9632000000 | 15784000000 |
| Sunday, January 1, 2017 | 13767000000 | 15884000000 |
| Monday, January 1, 2018 | 17003000000 | 16516000000 |
| Tuesday, January 1, 2019 | 16416000000 | 19981000000 |
| Wednesday, January 1, 2020 | 12077000000 | 8531000000 |
| Friday, January 1, 2021 | 15003000000 | 12491000000 |
| Saturday, January 1, 2022 | 17512000000 | 13668000000 |
| Sunday, January 1, 2023 | 23263000000 | 12089000000 |
| Monday, January 1, 2024 | 23324000000 | 15410000000 |
Unlocking the unknown
In the ever-evolving landscape of industrial giants, Caterpillar Inc. and RTX Corporation have been pivotal players. Over the past decade, these companies have showcased intriguing trends in their gross profit performance. From 2014 to 2023, Caterpillar Inc. experienced a remarkable 57% increase in gross profit, peaking in 2023. This growth trajectory highlights Caterpillar's resilience and strategic prowess in navigating market challenges.
Conversely, RTX Corporation's journey has been more volatile. Despite a strong start in 2014, with a gross profit 19% higher than Caterpillar's, RTX faced a significant dip in 2020, dropping to its lowest point. However, by 2023, RTX managed a recovery, albeit still trailing behind Caterpillar.
These trends underscore the dynamic nature of the industrial sector, where strategic decisions and market conditions can dramatically influence financial outcomes.
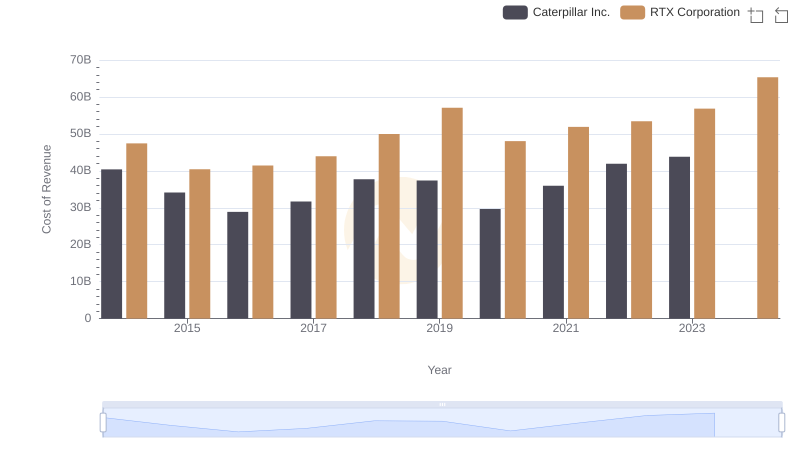
Analyzing Cost of Revenue: Caterpillar Inc. and RTX Corporation

Comparing SG&A Expenses: Caterpillar Inc. vs RTX Corporation Trends and Insights

Gross Profit Trends Compared: Caterpillar Inc. vs Honeywell International Inc.

Gross Profit Comparison: Caterpillar Inc. and Lockheed Martin Corporation Trends

Who Generates Higher Gross Profit? Caterpillar Inc. or Automatic Data Processing, Inc.