| __timestamp | Adobe Inc. | NetApp, Inc. |
|---|---|---|
| Wednesday, January 1, 2014 | 2215140000 | 2179200000 |
| Thursday, January 1, 2015 | 2215161000 | 2197400000 |
| Friday, January 1, 2016 | 2487907000 | 2099000000 |
| Sunday, January 1, 2017 | 2822298000 | 1904000000 |
| Monday, January 1, 2018 | 3365727000 | 2009000000 |
| Tuesday, January 1, 2019 | 4124984000 | 1935000000 |
| Wednesday, January 1, 2020 | 4559000000 | 1848000000 |
| Friday, January 1, 2021 | 5406000000 | 2001000000 |
| Saturday, January 1, 2022 | 6187000000 | 2136000000 |
| Sunday, January 1, 2023 | 6764000000 | 2094000000 |
| Monday, January 1, 2024 | 7293000000 | 2136000000 |
Infusing magic into the data realm
In the ever-evolving tech landscape, understanding operational efficiency is crucial. This analysis delves into the Selling, General, and Administrative (SG&A) expenses of Adobe Inc. and NetApp, Inc. from 2014 to 2024. Adobe's SG&A expenses have surged by approximately 229% over the decade, reflecting its aggressive growth strategy and market expansion. In contrast, NetApp's expenses have remained relatively stable, with a modest increase of about 3% over the same period, indicating a more conservative approach.
Adobe's significant rise in SG&A expenses, peaking at $7.3 billion in 2024, underscores its commitment to innovation and market leadership. Meanwhile, NetApp's steady expenses, hovering around $2.1 billion, highlight its focus on maintaining operational efficiency. This comparison offers valuable insights into how these tech giants allocate resources to drive growth and sustain competitive advantage.
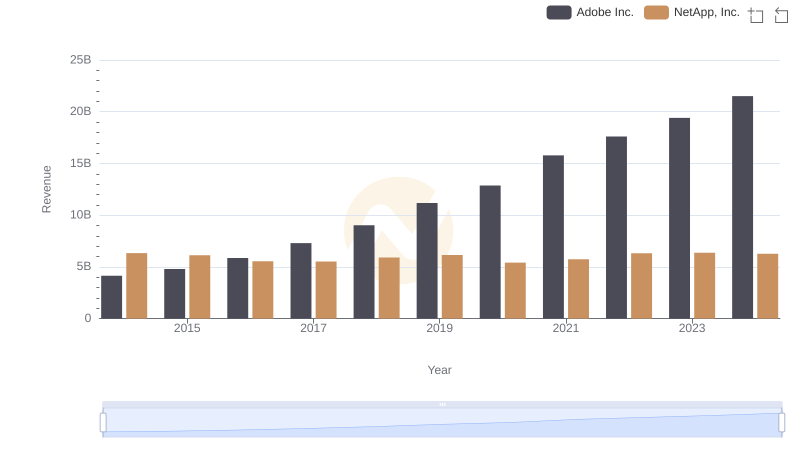
Who Generates More Revenue? Adobe Inc. or NetApp, Inc.
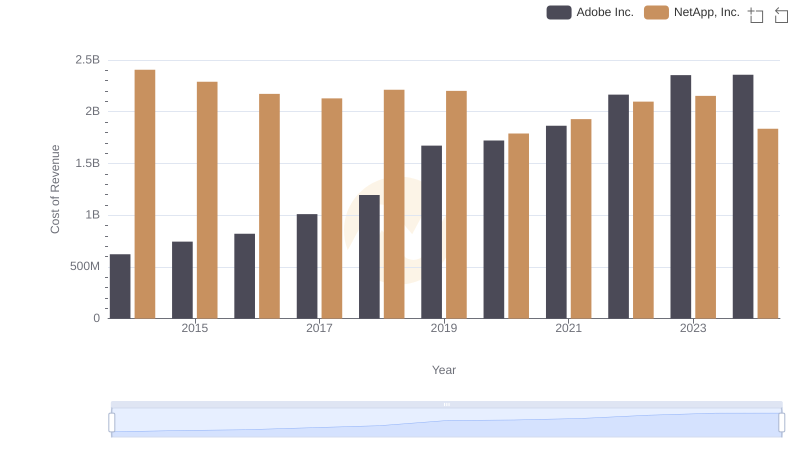
Cost of Revenue Comparison: Adobe Inc. vs NetApp, Inc.
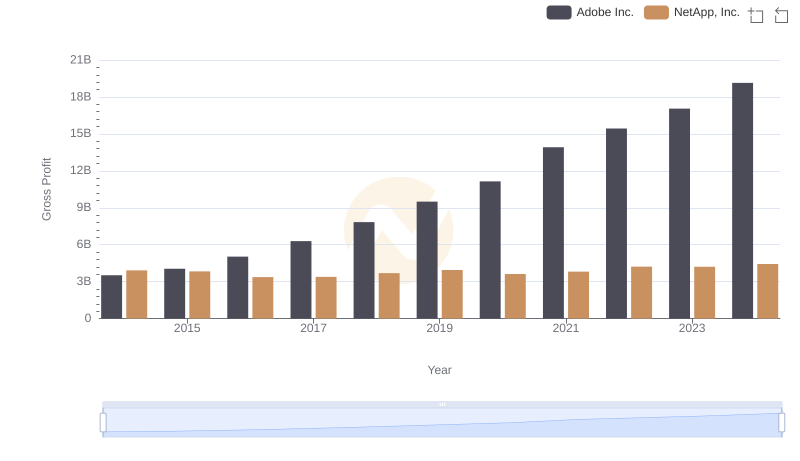
Gross Profit Trends Compared: Adobe Inc. vs NetApp, Inc.
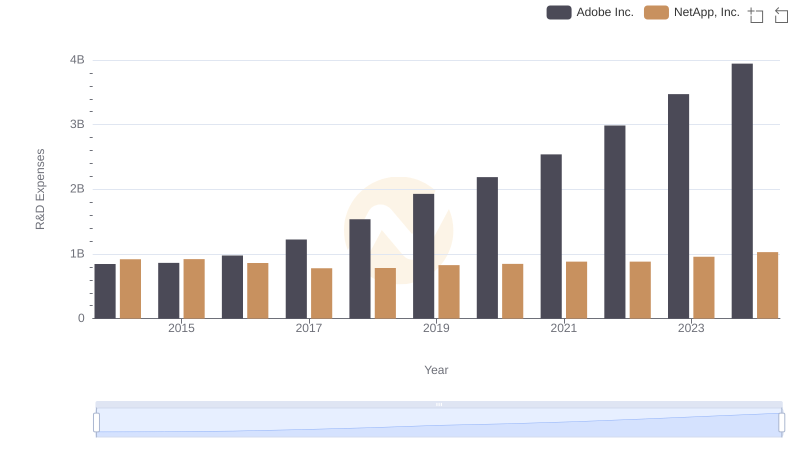
Adobe Inc. or NetApp, Inc.: Who Invests More in Innovation?
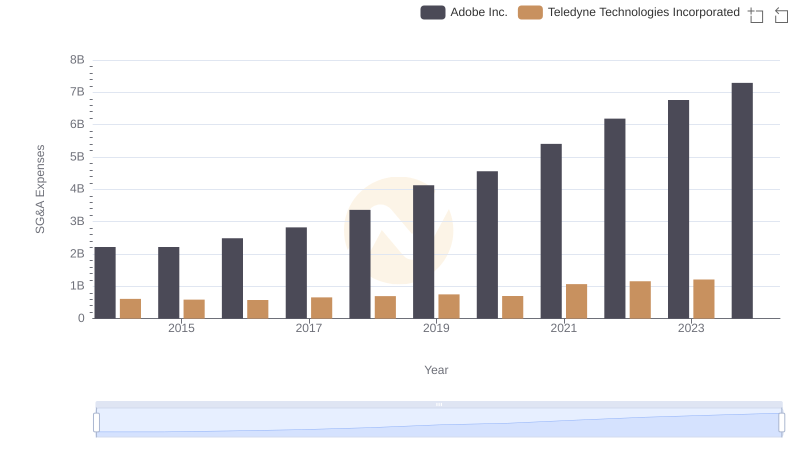
SG&A Efficiency Analysis: Comparing Adobe Inc. and Teledyne Technologies Incorporated
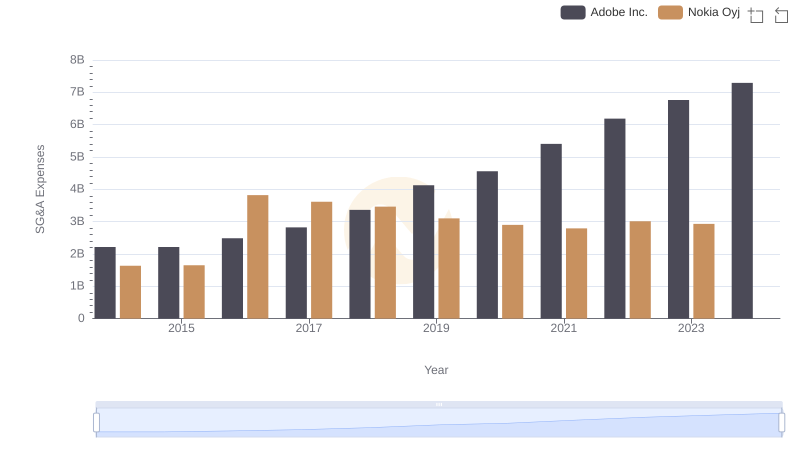
Operational Costs Compared: SG&A Analysis of Adobe Inc. and Nokia Oyj
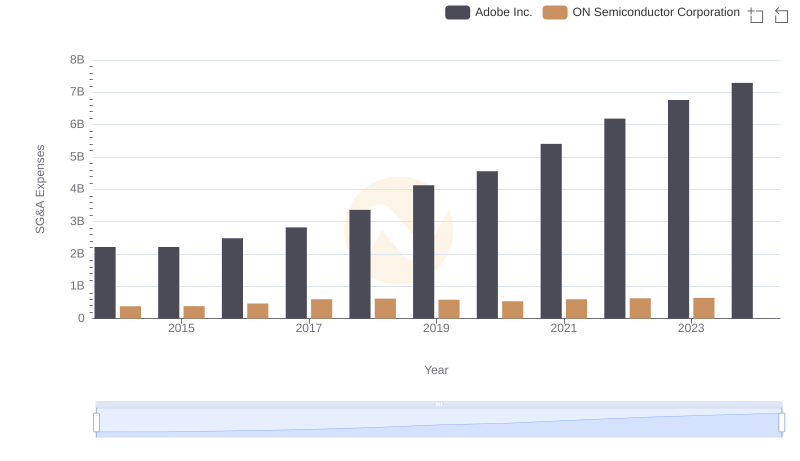
Operational Costs Compared: SG&A Analysis of Adobe Inc. and ON Semiconductor Corporation
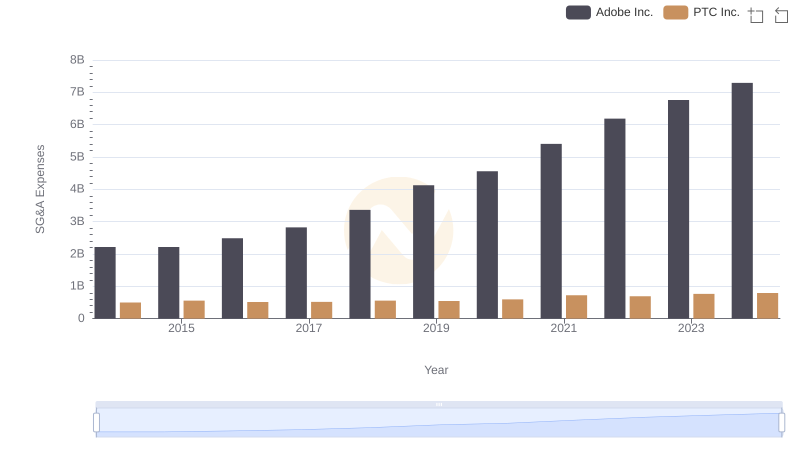
Selling, General, and Administrative Costs: Adobe Inc. vs PTC Inc.
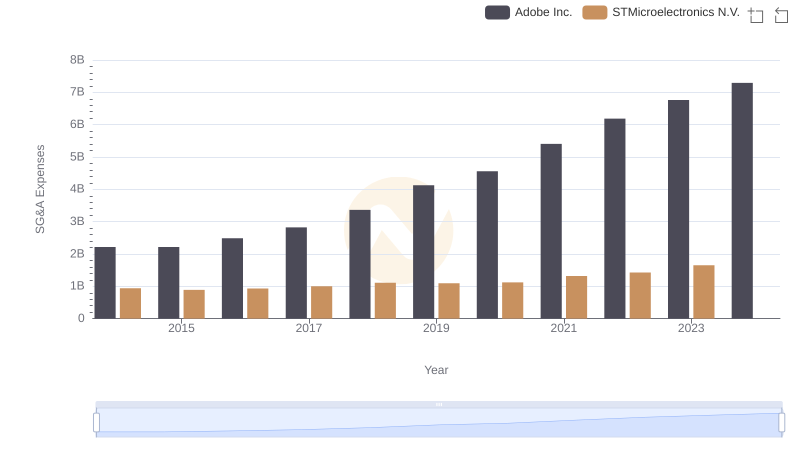
SG&A Efficiency Analysis: Comparing Adobe Inc. and STMicroelectronics N.V.
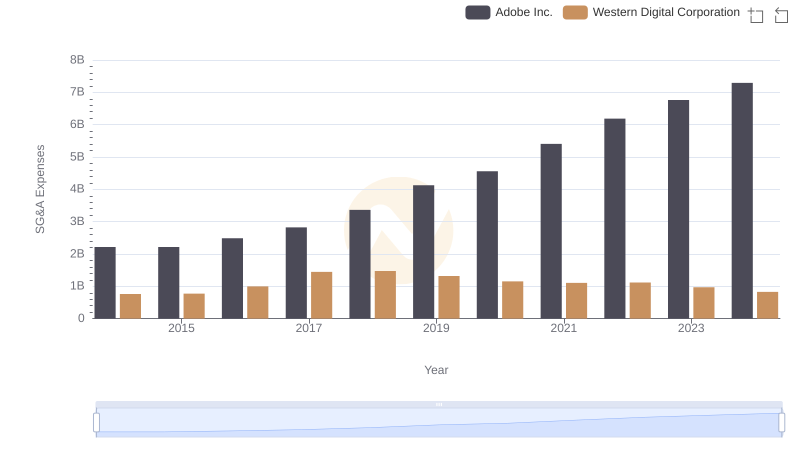
Adobe Inc. vs Western Digital Corporation: SG&A Expense Trends
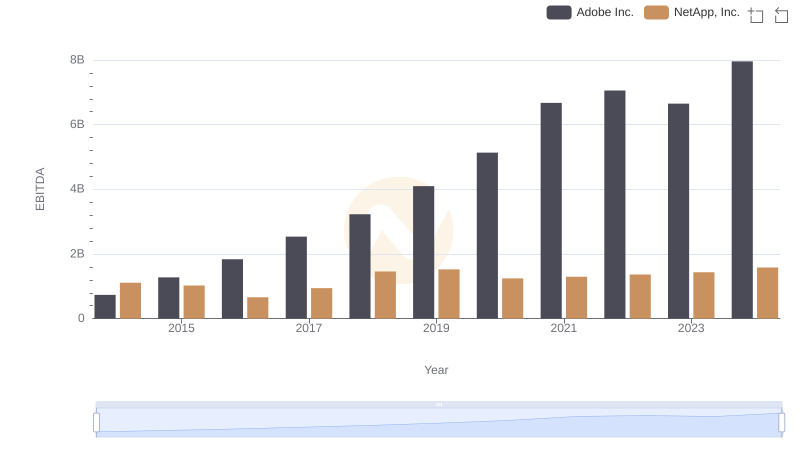
Comparative EBITDA Analysis: Adobe Inc. vs NetApp, Inc.
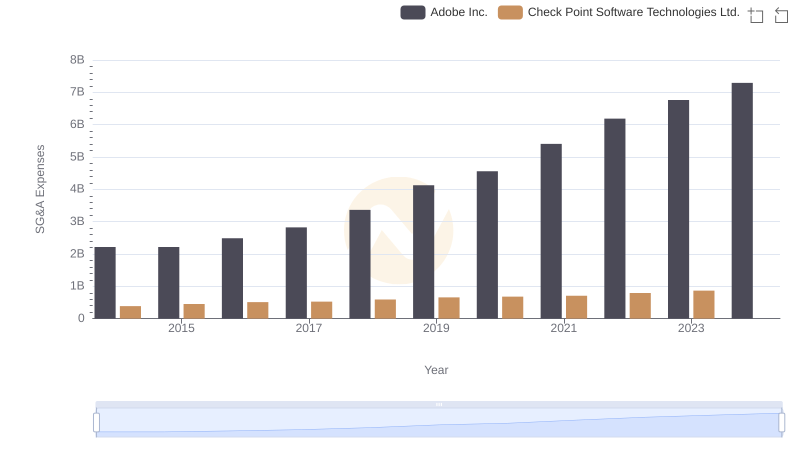
Adobe Inc. and Check Point Software Technologies Ltd.: SG&A Spending Patterns Compared