| __timestamp | Emerson Electric Co. | Waste Management, Inc. |
|---|---|---|
| Wednesday, January 1, 2014 | 14379000000 | 9002000000 |
| Thursday, January 1, 2015 | 13256000000 | 8231000000 |
| Friday, January 1, 2016 | 8260000000 | 8486000000 |
| Sunday, January 1, 2017 | 8860000000 | 9021000000 |
| Monday, January 1, 2018 | 9948000000 | 9249000000 |
| Tuesday, January 1, 2019 | 10557000000 | 9496000000 |
| Wednesday, January 1, 2020 | 9776000000 | 9341000000 |
| Friday, January 1, 2021 | 10673000000 | 11111000000 |
| Saturday, January 1, 2022 | 11441000000 | 12294000000 |
| Sunday, January 1, 2023 | 7738000000 | 12606000000 |
| Monday, January 1, 2024 | 9684000000 | 13383000000 |
Unleashing the power of data
In the ever-evolving landscape of industrial giants, Waste Management, Inc. and Emerson Electric Co. have showcased intriguing cost of revenue trends over the past decade. From 2014 to 2023, Emerson Electric Co. experienced a notable fluctuation, peaking in 2014 with a cost of revenue of approximately $14.4 billion, before dipping to around $7.7 billion in 2023. This represents a significant decrease of nearly 46%. In contrast, Waste Management, Inc. demonstrated a steady upward trajectory, culminating in a 40% increase from 2014 to 2023, reaching approximately $12.6 billion.
The data highlights the resilience of Waste Management, Inc. amidst economic shifts, while Emerson Electric Co. faced more volatility. These trends offer valuable insights into the operational efficiencies and market strategies of these industry leaders. Notably, data for Waste Management, Inc. in 2024 is missing, leaving room for speculation on future performance.
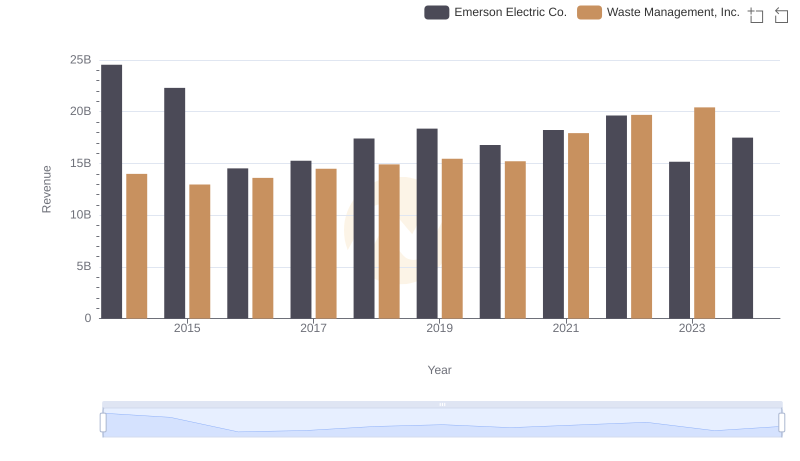
Waste Management, Inc. vs Emerson Electric Co.: Annual Revenue Growth Compared
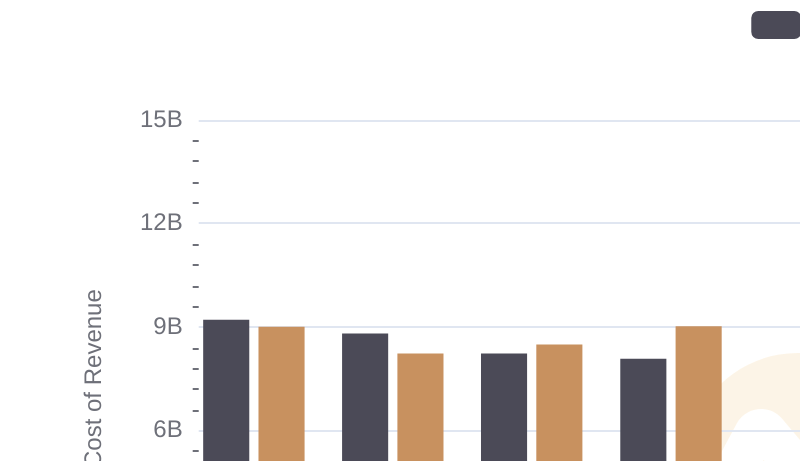
Comparing Cost of Revenue Efficiency: Waste Management, Inc. vs Thomson Reuters Corporation
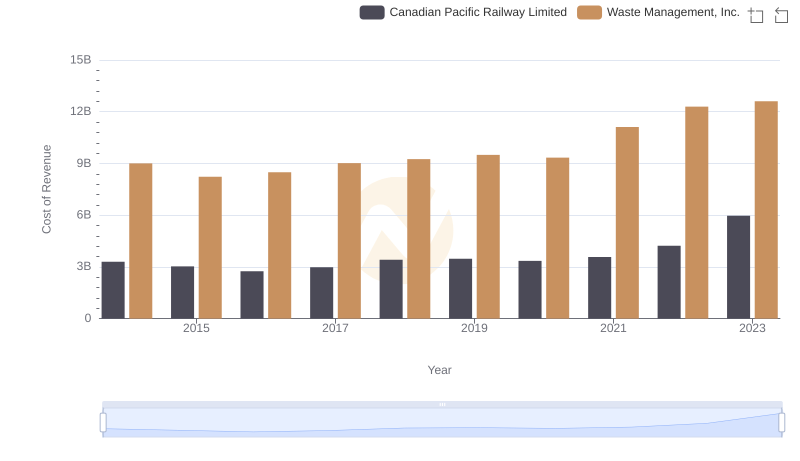
Comparing Cost of Revenue Efficiency: Waste Management, Inc. vs Canadian Pacific Railway Limited
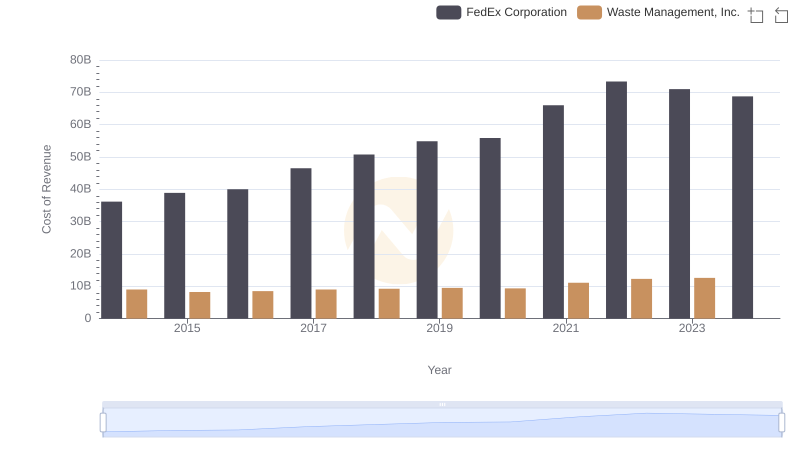
Comparing Cost of Revenue Efficiency: Waste Management, Inc. vs FedEx Corporation
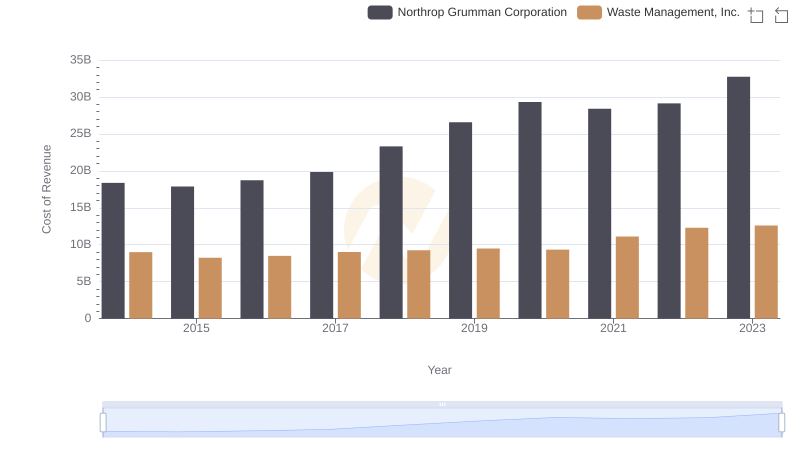
Cost Insights: Breaking Down Waste Management, Inc. and Northrop Grumman Corporation's Expenses
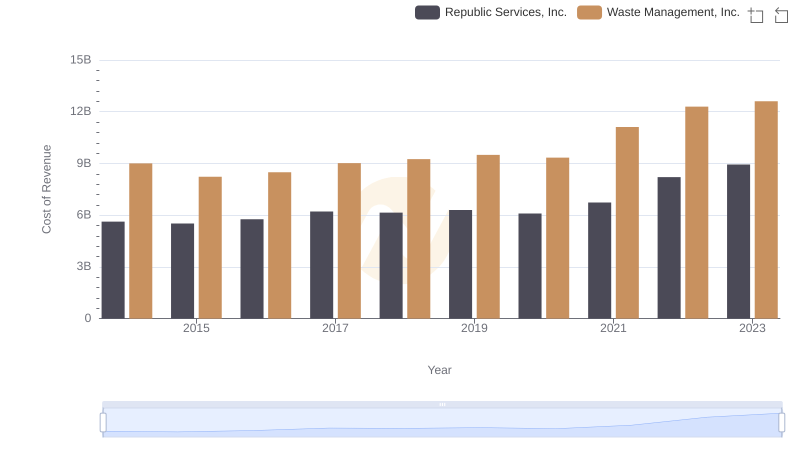
Analyzing Cost of Revenue: Waste Management, Inc. and Republic Services, Inc.
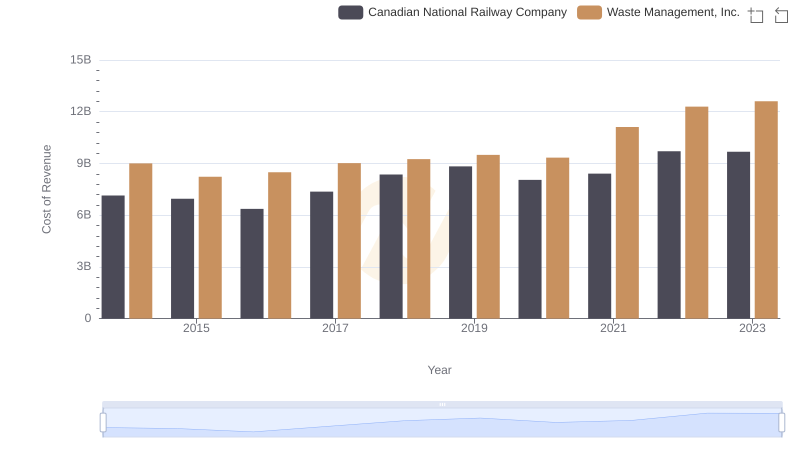
Waste Management, Inc. vs Canadian National Railway Company: Efficiency in Cost of Revenue Explored
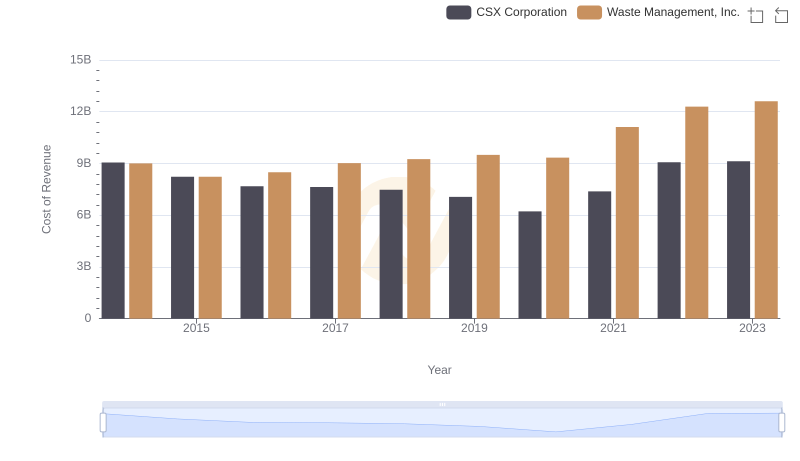
Cost of Revenue Comparison: Waste Management, Inc. vs CSX Corporation
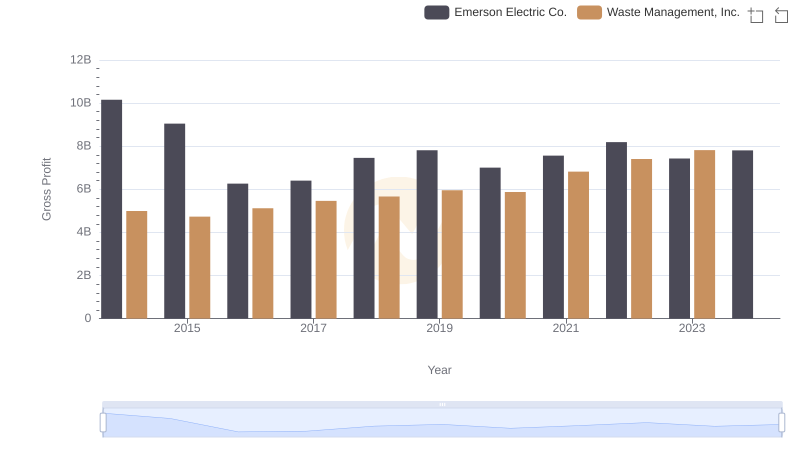
Who Generates Higher Gross Profit? Waste Management, Inc. or Emerson Electric Co.
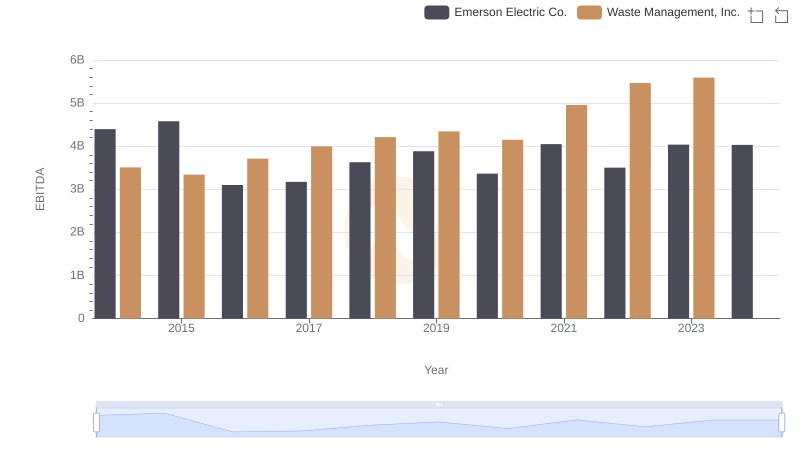
A Side-by-Side Analysis of EBITDA: Waste Management, Inc. and Emerson Electric Co.