| __timestamp | Deere & Company | Union Pacific Corporation |
|---|---|---|
| Wednesday, January 1, 2014 | 6912900000 | 10808000000 |
| Thursday, January 1, 2015 | 5196500000 | 10290000000 |
| Friday, January 1, 2016 | 4697500000 | 9502000000 |
| Sunday, January 1, 2017 | 5295800000 | 10456000000 |
| Monday, January 1, 2018 | 6613400000 | 10802000000 |
| Tuesday, January 1, 2019 | 8135000000 | 11013000000 |
| Wednesday, January 1, 2020 | 7721000000 | 10331000000 |
| Friday, January 1, 2021 | 10410000000 | 11843000000 |
| Saturday, January 1, 2022 | 11030000000 | 12636000000 |
| Sunday, January 1, 2023 | 17036000000 | 11928000000 |
| Monday, January 1, 2024 | 14672000000 | 12461000000 |
Unlocking the unknown
In the competitive landscape of American industry, Union Pacific Corporation and Deere & Company stand as titans. Over the past decade, their EBITDA performance has painted a vivid picture of resilience and growth. From 2014 to 2023, Union Pacific consistently outperformed Deere, with EBITDA figures peaking at approximately $12.6 billion in 2022. However, Deere & Company showcased a remarkable surge, with a 146% increase from 2016 to 2023, reaching a high of $17 billion in 2023. This growth trajectory highlights Deere's strategic advancements in the agricultural sector, while Union Pacific's steady performance underscores its dominance in the transportation industry. As we look to 2024, both companies continue to demonstrate robust financial health, with Union Pacific maintaining a strong EBITDA of $12.5 billion and Deere slightly retracting to $14.7 billion. This financial narrative not only reflects their past achievements but also sets the stage for future endeavors.
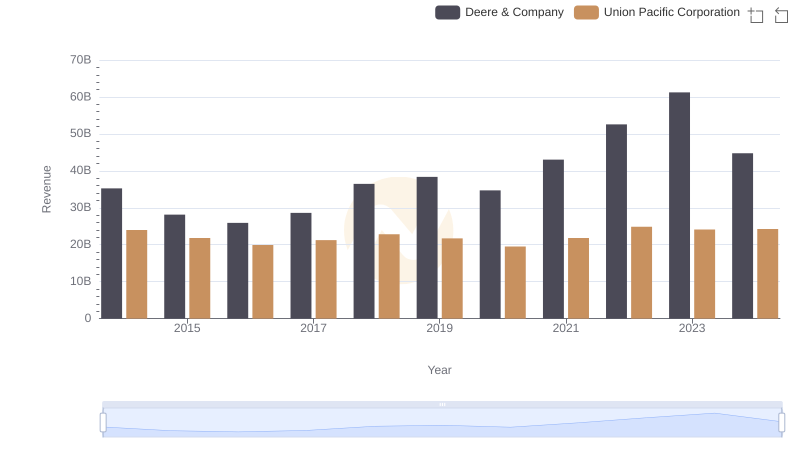
Union Pacific Corporation vs Deere & Company: Examining Key Revenue Metrics

Union Pacific Corporation vs Deere & Company: A Gross Profit Performance Breakdown
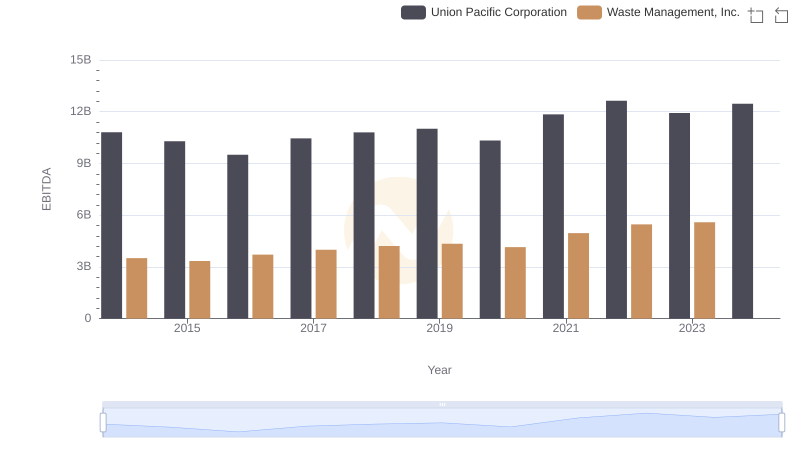
EBITDA Metrics Evaluated: Union Pacific Corporation vs Waste Management, Inc.
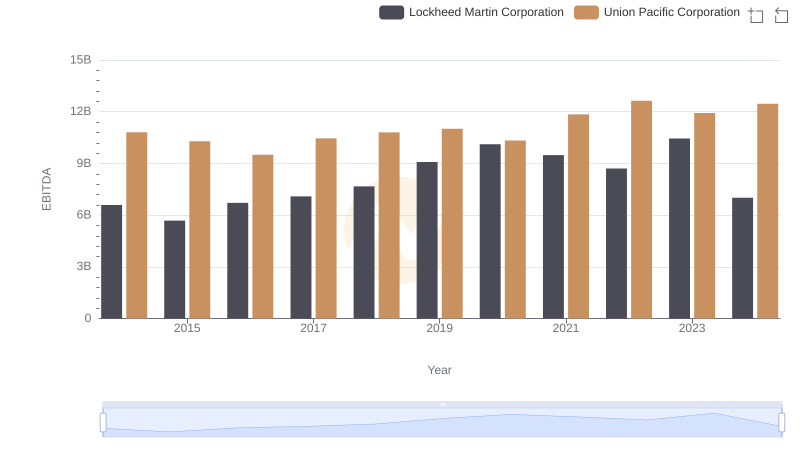
Comparative EBITDA Analysis: Union Pacific Corporation vs Lockheed Martin Corporation
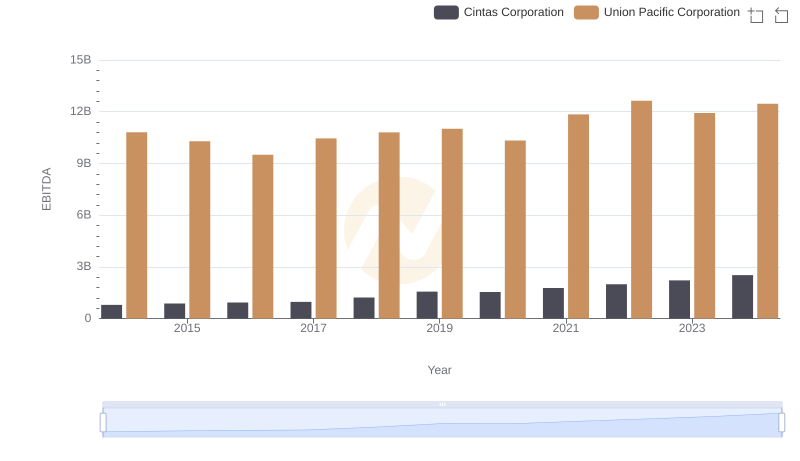
A Side-by-Side Analysis of EBITDA: Union Pacific Corporation and Cintas Corporation
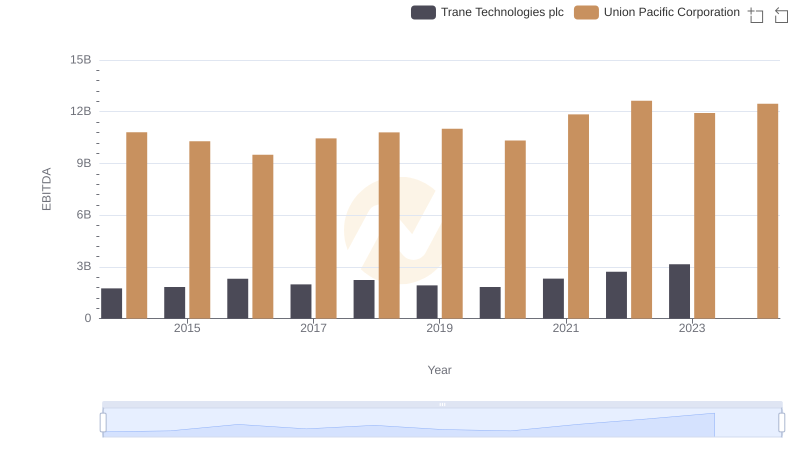
Comparative EBITDA Analysis: Union Pacific Corporation vs Trane Technologies plc