| __timestamp | Lockheed Martin Corporation | Union Pacific Corporation |
|---|---|---|
| Wednesday, January 1, 2014 | 6592000000 | 10808000000 |
| Thursday, January 1, 2015 | 5687000000 | 10290000000 |
| Friday, January 1, 2016 | 6716000000 | 9502000000 |
| Sunday, January 1, 2017 | 7092000000 | 10456000000 |
| Monday, January 1, 2018 | 7667000000 | 10802000000 |
| Tuesday, January 1, 2019 | 9083000000 | 11013000000 |
| Wednesday, January 1, 2020 | 10116000000 | 10331000000 |
| Friday, January 1, 2021 | 9483000000 | 11843000000 |
| Saturday, January 1, 2022 | 8707000000 | 12636000000 |
| Sunday, January 1, 2023 | 10444000000 | 11928000000 |
| Monday, January 1, 2024 | 8815000000 | 12461000000 |
Infusing magic into the data realm
In the ever-evolving landscape of American industry, Union Pacific Corporation and Lockheed Martin Corporation stand as titans in their respective fields. Over the past decade, from 2014 to 2024, these giants have showcased their financial prowess through EBITDA performance.
Union Pacific, a leader in the transportation sector, consistently outperformed Lockheed Martin, a defense and aerospace behemoth, in terms of EBITDA. Notably, Union Pacific's EBITDA peaked in 2022, reaching approximately 12.6 billion, marking a 33% increase from its 2016 low. Meanwhile, Lockheed Martin's EBITDA saw a significant rise in 2023, hitting around 10.4 billion, a 54% increase from its 2015 low.
This comparative analysis highlights the resilience and growth strategies of these corporations, offering insights into their financial health and strategic direction. As we look to the future, these trends provide a window into the evolving dynamics of American industry.

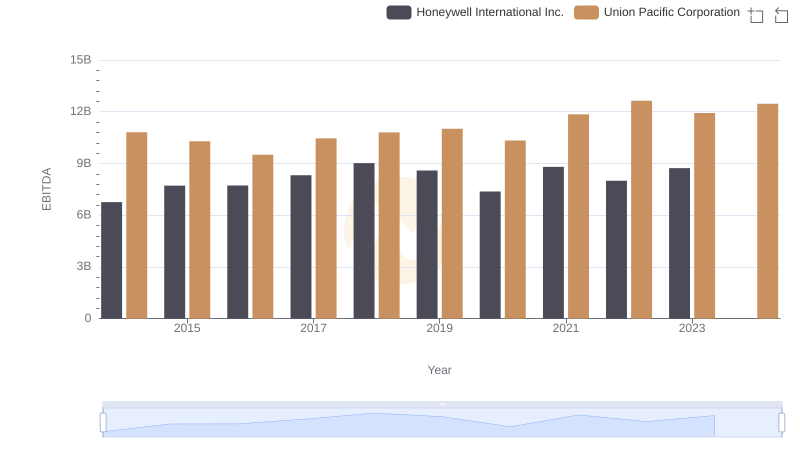
EBITDA Metrics Evaluated: Union Pacific Corporation vs Honeywell International Inc.

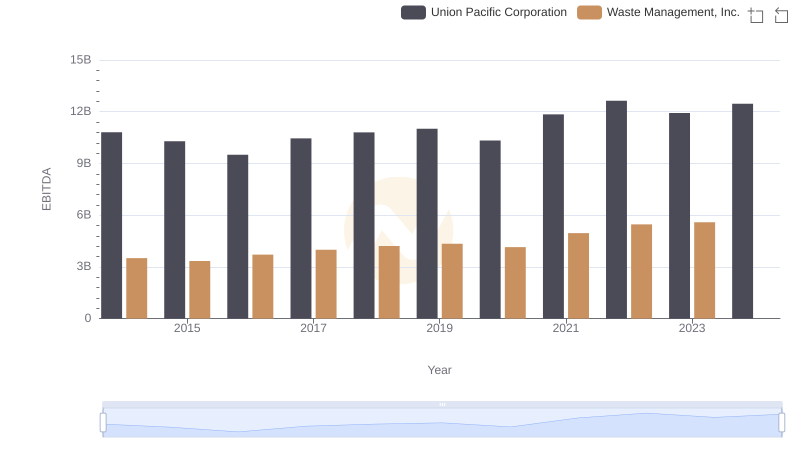
EBITDA Metrics Evaluated: Union Pacific Corporation vs Waste Management, Inc.

EBITDA Performance Review: Union Pacific Corporation vs Deere & Company

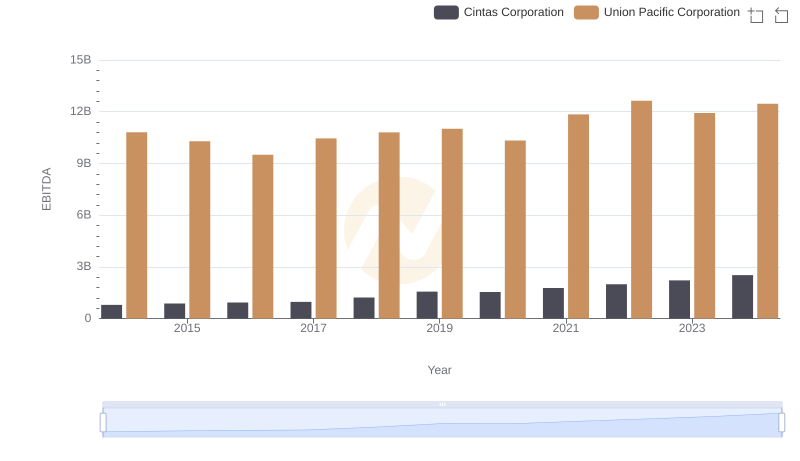
A Side-by-Side Analysis of EBITDA: Union Pacific Corporation and Cintas Corporation

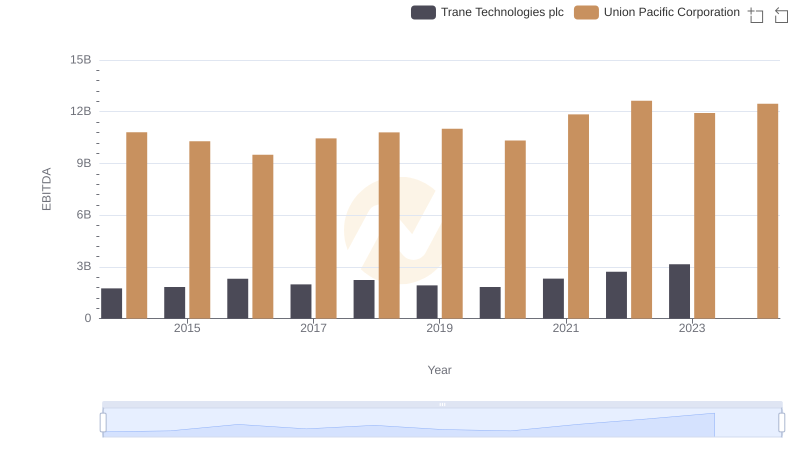
Comparative EBITDA Analysis: Union Pacific Corporation vs Trane Technologies plc