| __timestamp | Infosys Limited | TE Connectivity Ltd. |
|---|---|---|
| Wednesday, January 1, 2014 | 2258000000 | 2438000000 |
| Thursday, January 1, 2015 | 2590000000 | 2327000000 |
| Friday, January 1, 2016 | 2765000000 | 1874000000 |
| Sunday, January 1, 2017 | 2936000000 | 2461000000 |
| Monday, January 1, 2018 | 2984000000 | 3014000000 |
| Tuesday, January 1, 2019 | 3053000000 | 2689000000 |
| Wednesday, January 1, 2020 | 4053342784 | 1283000000 |
| Friday, January 1, 2021 | 4116000000 | 3479000000 |
| Saturday, January 1, 2022 | 4707334610 | 3584000000 |
| Sunday, January 1, 2023 | 4206000000 | 3142000000 |
| Monday, January 1, 2024 | 3848000000 |
Cracking the code
In the ever-evolving landscape of global technology and connectivity, Infosys Limited and TE Connectivity Ltd. stand as titans in their respective fields. Over the past decade, these companies have demonstrated remarkable financial resilience, as evidenced by their EBITDA performance. From 2014 to 2023, Infosys Limited saw a robust growth trajectory, with EBITDA increasing by approximately 86%, peaking in 2022. Meanwhile, TE Connectivity Ltd. showcased a steady climb, with a notable 47% rise in EBITDA over the same period, reaching its zenith in 2024.
Despite the challenges posed by global economic shifts, both companies have maintained a competitive edge, with Infosys consistently outperforming TE Connectivity in most years. However, TE Connectivity's recent surge in 2024 suggests a strategic pivot that could redefine industry benchmarks. As we look to the future, the absence of Infosys's 2024 data leaves room for speculation on its next financial move.
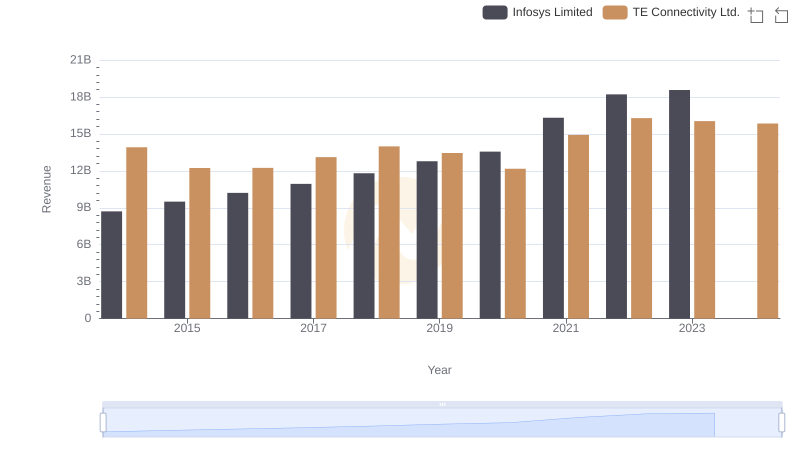
Infosys Limited or TE Connectivity Ltd.: Who Leads in Yearly Revenue?
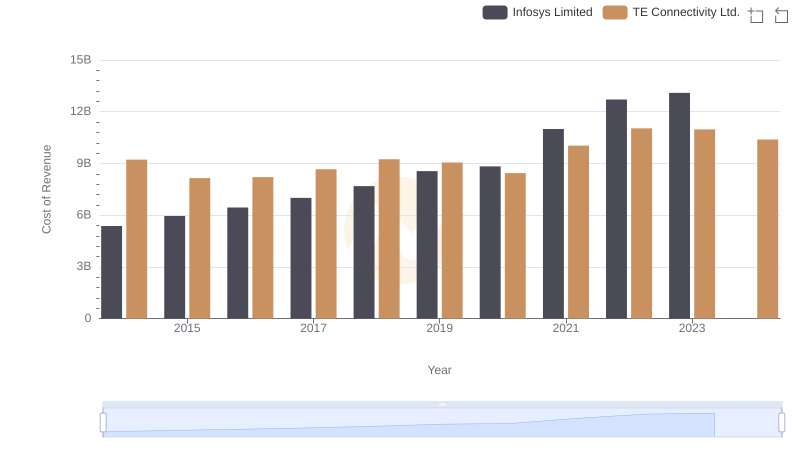
Cost Insights: Breaking Down Infosys Limited and TE Connectivity Ltd.'s Expenses
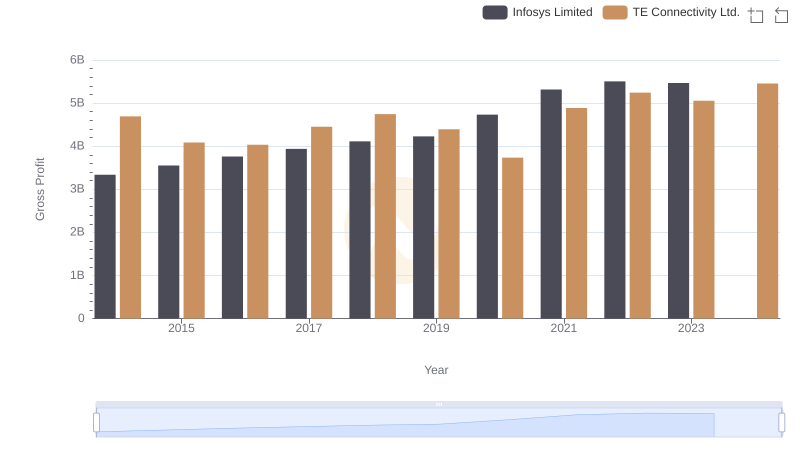
Who Generates Higher Gross Profit? Infosys Limited or TE Connectivity Ltd.
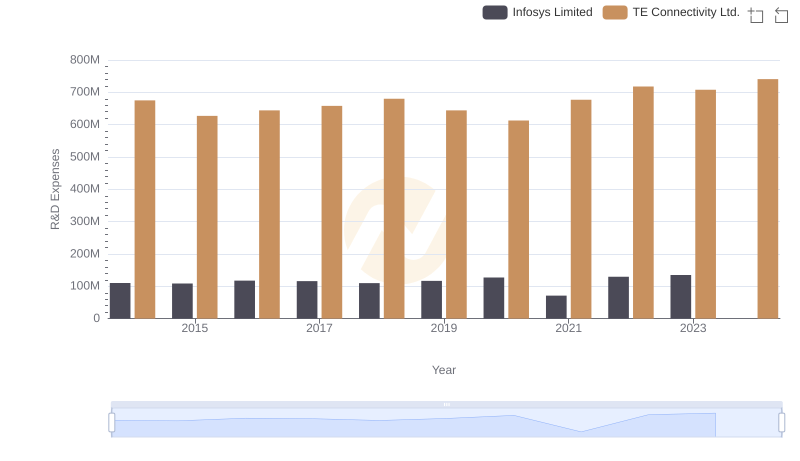
Comparing Innovation Spending: Infosys Limited and TE Connectivity Ltd.
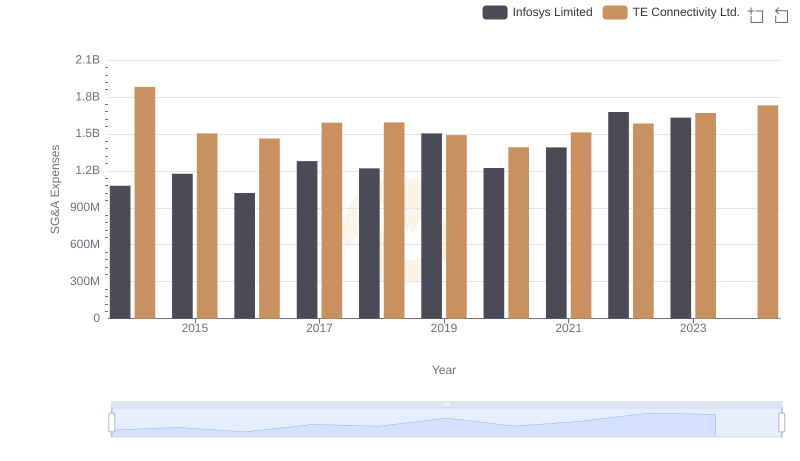
Breaking Down SG&A Expenses: Infosys Limited vs TE Connectivity Ltd.
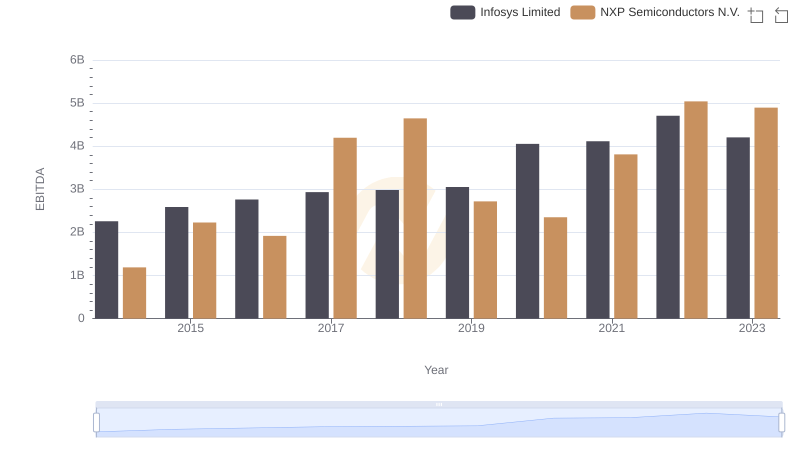
EBITDA Metrics Evaluated: Infosys Limited vs NXP Semiconductors N.V.
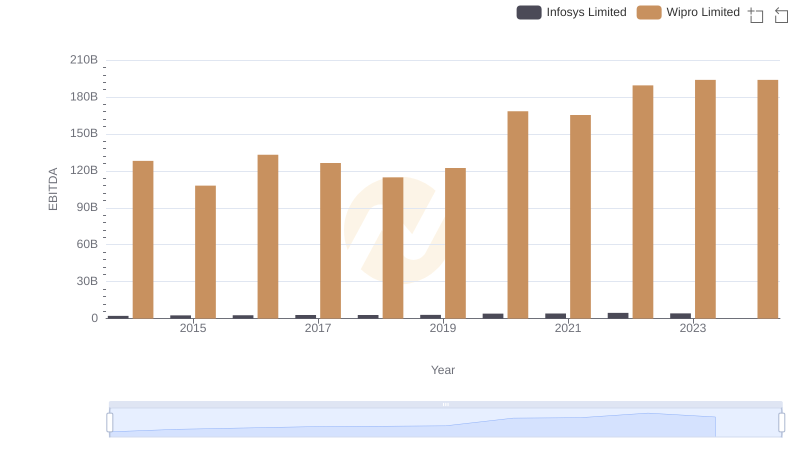
Comparative EBITDA Analysis: Infosys Limited vs Wipro Limited
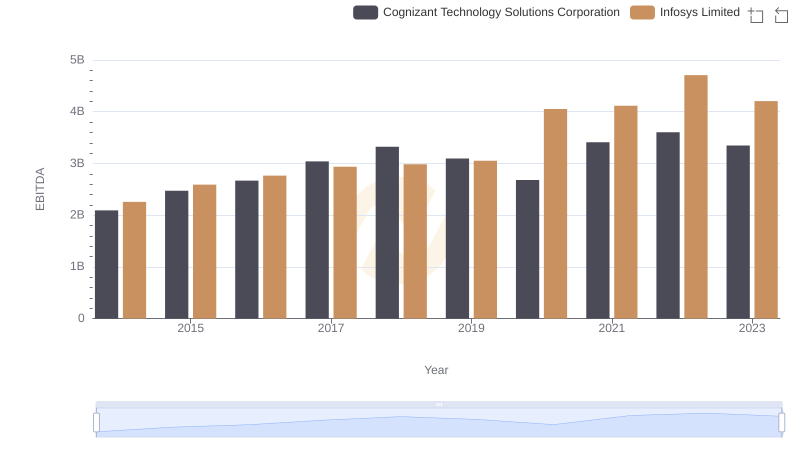
Professional EBITDA Benchmarking: Infosys Limited vs Cognizant Technology Solutions Corporation
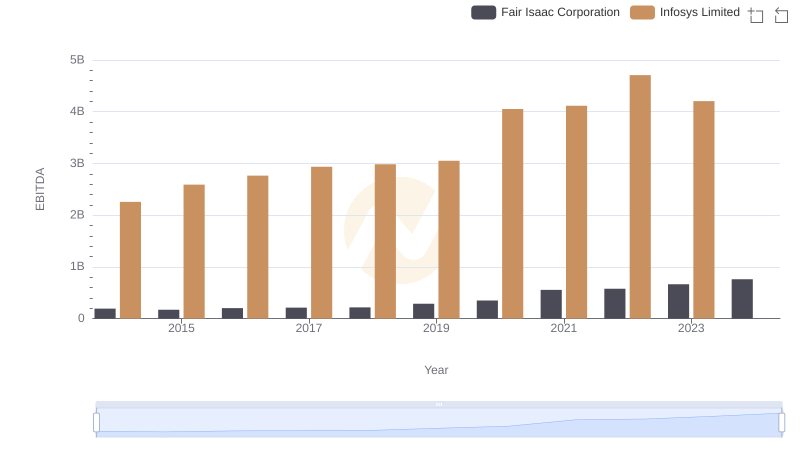
A Side-by-Side Analysis of EBITDA: Infosys Limited and Fair Isaac Corporation
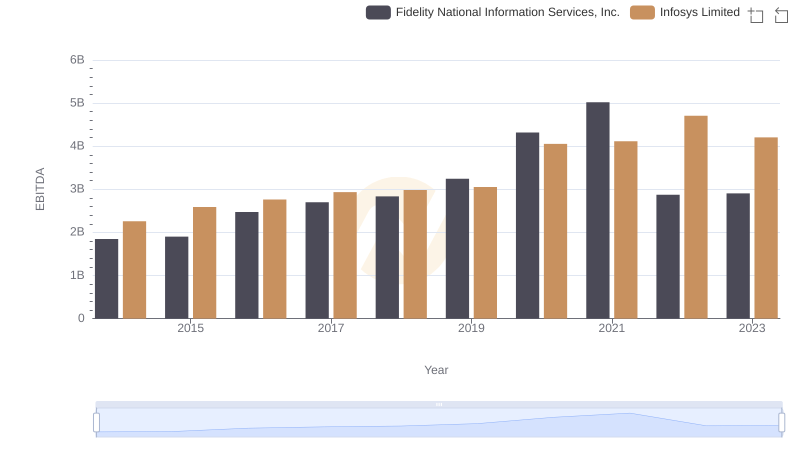
A Professional Review of EBITDA: Infosys Limited Compared to Fidelity National Information Services, Inc.
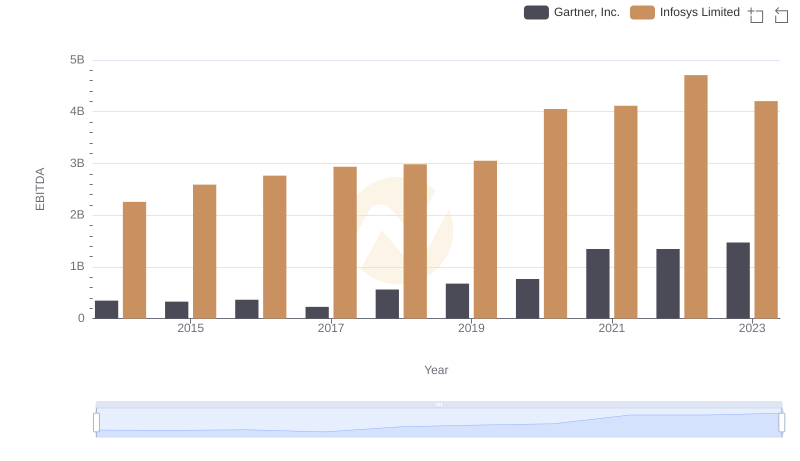
A Side-by-Side Analysis of EBITDA: Infosys Limited and Gartner, Inc.
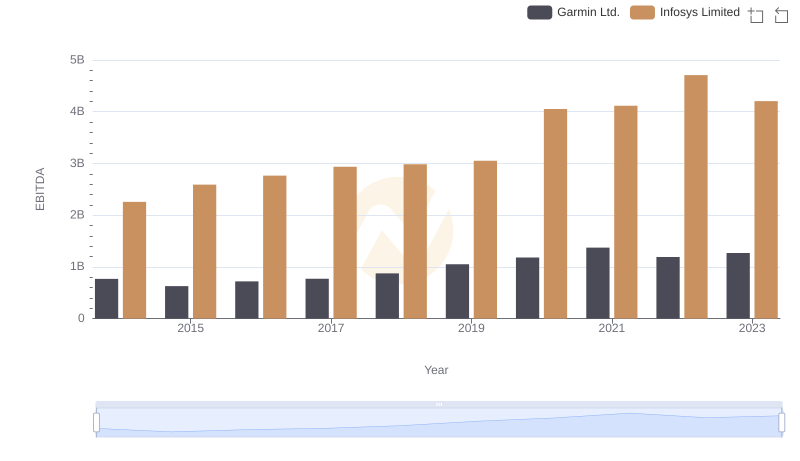
EBITDA Analysis: Evaluating Infosys Limited Against Garmin Ltd.