| __timestamp | Howmet Aerospace Inc. | Parker-Hannifin Corporation |
|---|---|---|
| Wednesday, January 1, 2014 | 1927000000 | 1832903000 |
| Thursday, January 1, 2015 | 1936000000 | 1861551000 |
| Friday, January 1, 2016 | 1457000000 | 1558088000 |
| Sunday, January 1, 2017 | 1517000000 | 1846306000 |
| Monday, January 1, 2018 | 1491000000 | 2382235000 |
| Tuesday, January 1, 2019 | 843000000 | 2513468000 |
| Wednesday, January 1, 2020 | 831000000 | 2431500000 |
| Friday, January 1, 2021 | 1095000000 | 3092383000 |
| Saturday, January 1, 2022 | 1260000000 | 2441242000 |
| Sunday, January 1, 2023 | 1465000000 | 4071687000 |
| Monday, January 1, 2024 | 1842000000 | 5028229000 |
Unleashing the power of data
In the ever-evolving landscape of industrial manufacturing, Parker-Hannifin Corporation and Howmet Aerospace Inc. stand as titans. Over the past decade, Parker-Hannifin has consistently outperformed Howmet Aerospace in terms of EBITDA, showcasing a robust growth trajectory. From 2014 to 2023, Parker-Hannifin's EBITDA surged by approximately 122%, peaking in 2023 with a remarkable 4.07 billion. In contrast, Howmet Aerospace experienced a more volatile journey, with a notable dip in 2019, where EBITDA fell to 843 million, before recovering to 1.47 billion in 2023. This analysis highlights Parker-Hannifin's strategic prowess in maintaining steady growth, while Howmet Aerospace's fluctuating performance underscores the challenges faced in the aerospace sector. As we look to the future, the missing data for 2024 leaves room for speculation on how these industry giants will navigate the post-pandemic economic landscape.
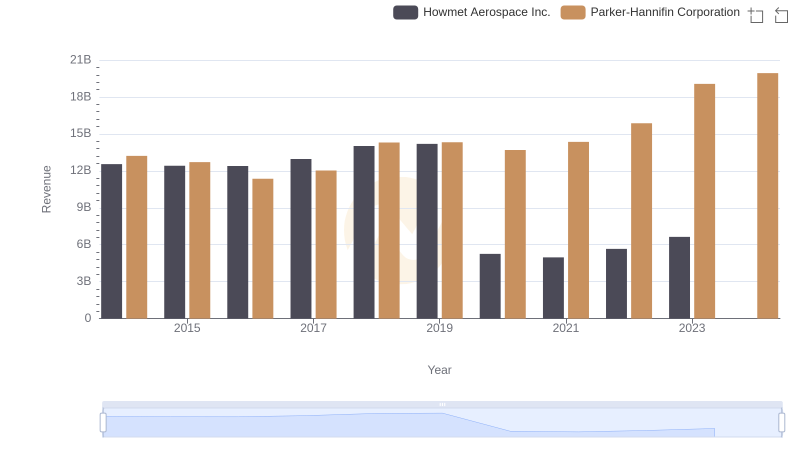
Breaking Down Revenue Trends: Parker-Hannifin Corporation vs Howmet Aerospace Inc.
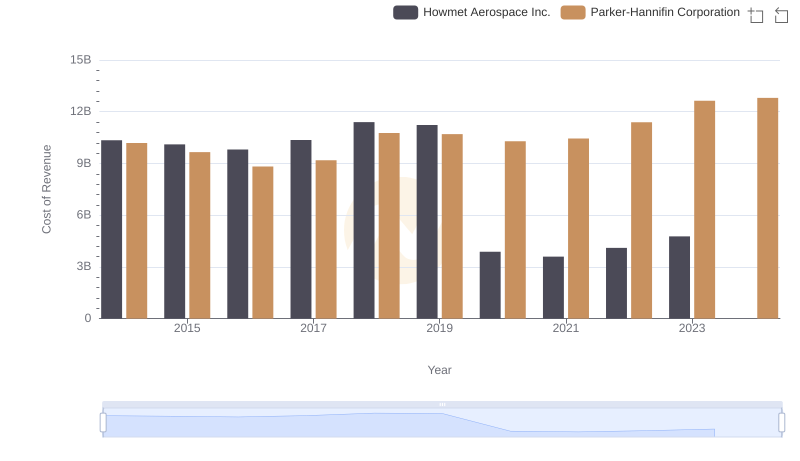
Analyzing Cost of Revenue: Parker-Hannifin Corporation and Howmet Aerospace Inc.
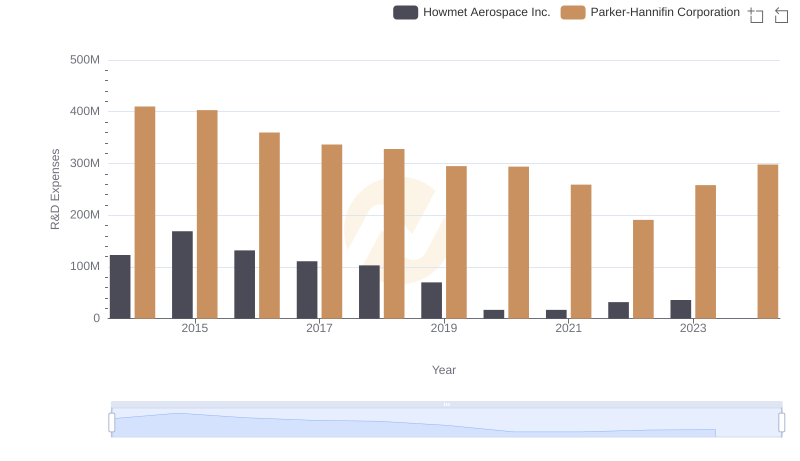
Analyzing R&D Budgets: Parker-Hannifin Corporation vs Howmet Aerospace Inc.
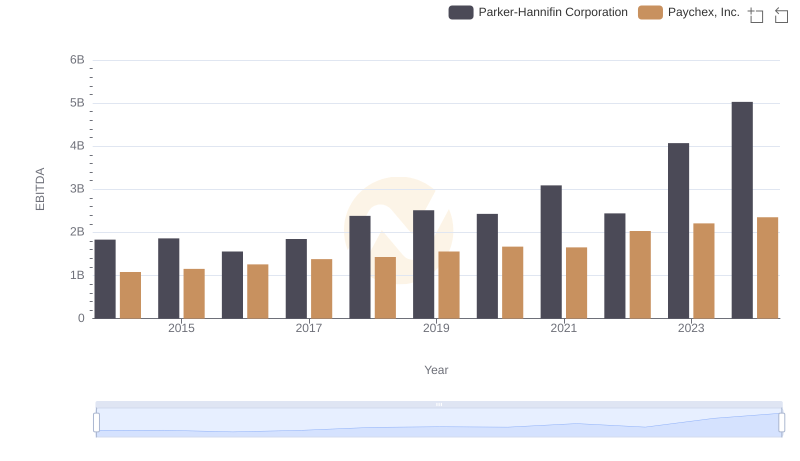
A Professional Review of EBITDA: Parker-Hannifin Corporation Compared to Paychex, Inc.
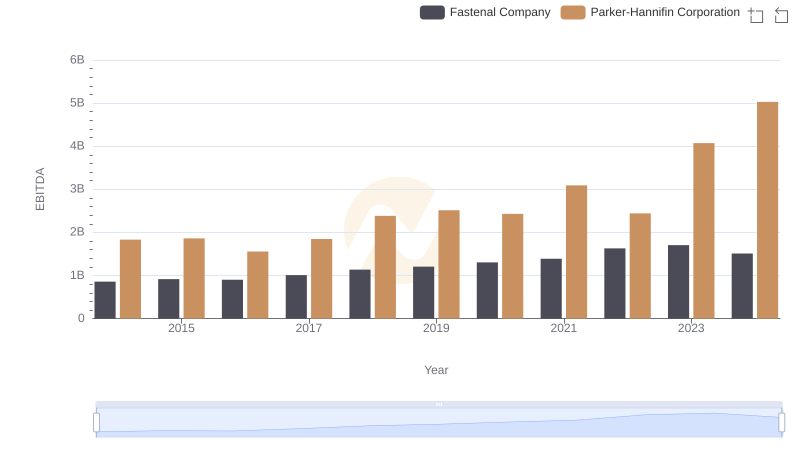
Parker-Hannifin Corporation and Fastenal Company: A Detailed Examination of EBITDA Performance
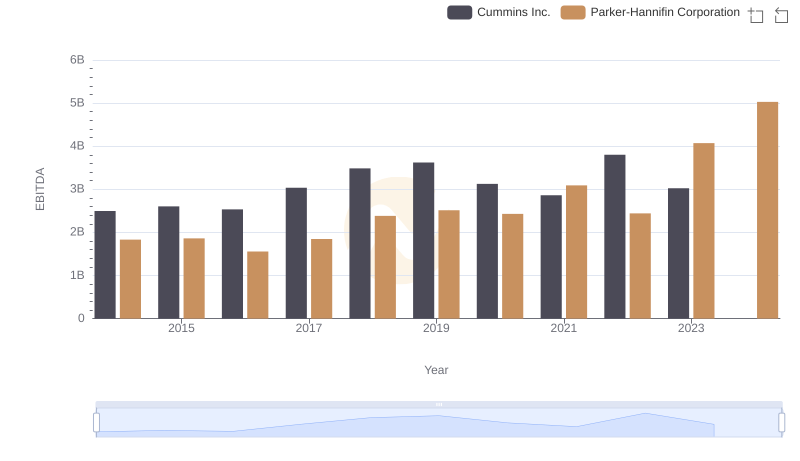
A Professional Review of EBITDA: Parker-Hannifin Corporation Compared to Cummins Inc.
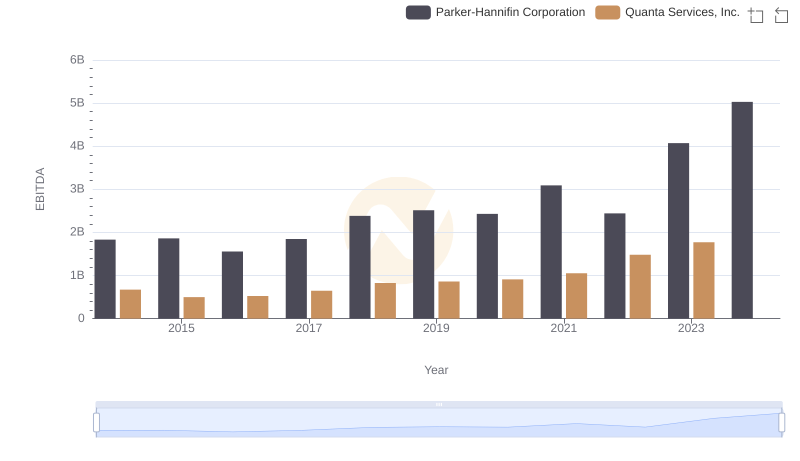
A Professional Review of EBITDA: Parker-Hannifin Corporation Compared to Quanta Services, Inc.
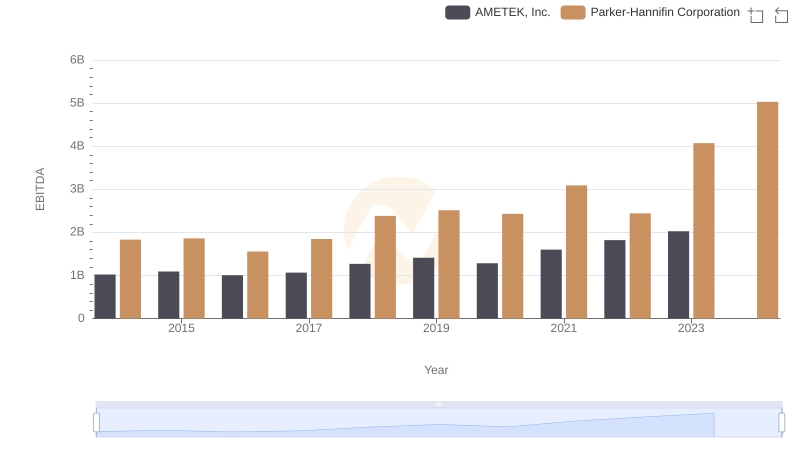
Parker-Hannifin Corporation and AMETEK, Inc.: A Detailed Examination of EBITDA Performance